
Share This Post Today!
Torbjørnskjær Lighthouse, Hvaler, Norway

This fully automated lighthouse stands at 59 feet tall and was originally constructed in 1872. The granite structure sits on the southern coast of Norway, south of Oslo.
Bastøy Lighthouse, Vestfold, Norway

This coastal lighthouse is located on an island off the southeast coast of Norway. The light station was established in 1840 and was automated in 1986.
*Feel free to send us your photos of Lighthouses to be featured in our weekly market observations.
Oracle expansion
Last week, Oracle reported its latest earnings. We discussed the earnings very briefly in last week’s edition of this commentary but wanted to expand our thoughts in this week’s edition.
Oracle shares moved much lower to end last week after earnings were released, dropping nearly 15%. Shares are down 45% from their 52-week and all-time highs. According to Bloomberg, Oracle’s investment-grade bonds are currently trading like junk bonds:
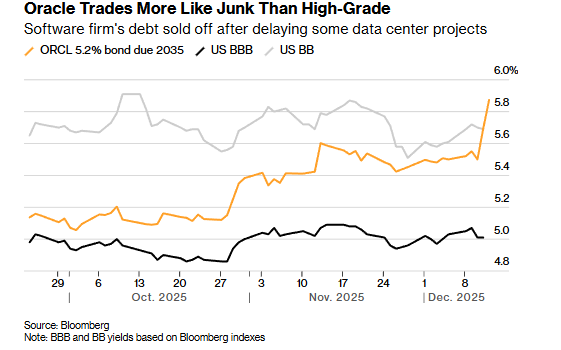
Oracle’s five-year credit default swaps traded at 144.3 basis points as of Friday, the highest since the financial crisis. This means it costs $144.3 a year to insure $10,000 of Oracle debt. In September, it only cost $43.62 to insure the same amount.
Investors have begun to examine the details closely in recent months and have stopped blindly following the AI trade. We are in the next phase of the cycle where quality matters.
Oracle has added billions in debt this year and has made large financial commitments for future funding of its AI data center projects. The company has also fueled many of these commitments through spending commitments from OpenAI, a company that burns cash and that is producing relatively no revenue, and there are worries the company will further delay monetization projects due to other companies like Alphabet catching up with them (in the AI chat box race). Oracle’s spending spree has led the company’s free cash flow to turn negative for the first time in decades:
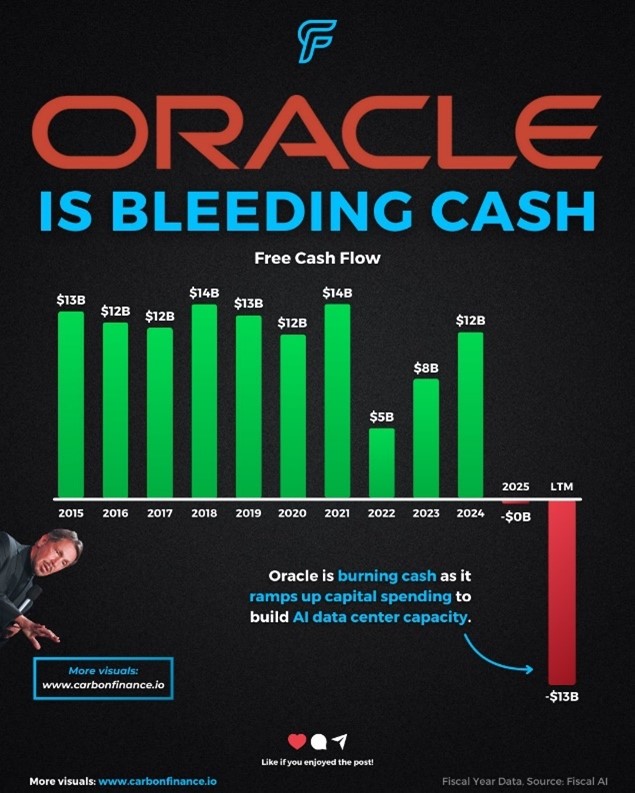
Oracle raised its spending forecast last week. The company made capital expenditures of $12 billion last quarter, $3.7 billion more than expected. The company’s adjusted debt, a measure that includes what it owes on leases in addition to what it owes creditors, is forecast to more than double to roughly $300 billion by 2028, according to credit analysts at Morgan Stanley.
On the positive front, Oracle announced on Monday that the company added $150 billion in new data center lease commitments this quarter, and total lease commitments have reached $248 billion as of November 30th. Total contract commitments reached $523 billion as of November 30th, and the company expects to realize 10% of the contracts over the next 12 months.
Overall, the earnings report was slightly negative in our opinion due to the company’s revenue miss and lower growth expectations but has not majorly changed our thesis. The company is extremely expensive, levered, and has elevated risks. We think some of the spending commitments in this space will not come to fruition, which will lower revenue and earnings estimates down the line for companies operating in the AI ecosystem. However, we think the immediate reaction to this earnings report may be overdone. Do not be surprised if shares rebound over the next few trading sessions.
Oracle is also suffering from the worry of many investors that AI applications and adoption rates could be slower than expected, which could impact Oracle’s revenue. Here is a chart from Bank of America that tracks the adoption rates by U.S. companies, which have slowed:
The other thing that worries us regarding adoption is that most of the adoption is from the largest firms, who have the capabilities to invest in this space and train staff. Smaller companies are dragging their heels in certain aspects.
Broadcom was the other large AI-related stock that reported earnings last week. The semiconductor manufacturing company has been a large beneficiary of AI adoption and growth. Shares have performed very well; before last week’s earnings, shares were up nearly 75% this year. However, shares have pulled back by 15% due to the company’s earnings. The company beat revenue and adjusted earnings-per-share estimates but failed to deliver what investors were looking for.
Investors were looking for a large AI chip deal with a new customer, but that did not happen. This is because on the company’s previous earnings call, the company CEO said his company secured a $10 billion AI order from a new qualified customer, which will improve its revenue outlook. On last week’s earnings call, they stated their new customer is Anthropic, which ordered $11 billion in AI chips for delivery in late 2026 (good news). But then things got confusing….. Broadcom’s CEO said they had a new customer that ordered $1 billion in chips for delivery in late 2026 but did not reveal the customer despite being questioned by analysts on the earnings call.
Investors are also concerned regarding Broadcom’s margins, which have compressed due to the company’s revenue mix, which is shifting toward lower-margin products and services. On the company’s earnings call, margins were forecasted to be lower than street expectations.
These two factors, paired with the overall AI sentiment (which has deteriorated), have wiped out billions in market capitalization in a matter of days for Broadcom. Broadcom was simply priced for perfection, leaving little room for error in any of the company’s figures or forecasts. Shares were also trading at very high prices and, in our opinion, remain expensive. In our eyes, it’s no surprise that the company’s shares have had their worst 3-day pullback since March 2020 after these results and their earnings call.
Broadcom and Oracle’s earnings bring us to the end of earnings for most companies as we head toward the holidays. The next big earnings week comes the week of January 12th, when the titans of Wall Street, Netflix, and Taiwan Semiconductor all report their latest earnings. Over the following weeks, most large U.S. firms will also report. In our opinion, the next big day for the AI trade comes when Taiwan Semiconductor reports, and we will be watching very closely.
Technical commodity breakout
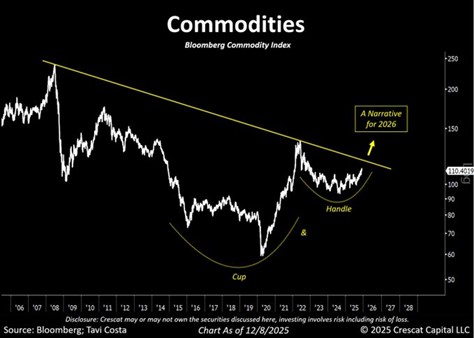
We often share charts created by Crescat Capital, a research firm and hedge fund that specializes in commodities. This week, one of their analysts shared an interesting photo of the Bloomberg Commodity Index since the mid-2000s. The chart looks to be approaching a long-term resistance line, which could be a major technical inflection point for the index.
Gold has led the way in 2025; while other commodities follow suit in 2026? We have mentioned the gold-to-silver ratio in past issues of this commentary, which makes silver look highly attractive at this point in the cycle. Don’t believe us? Take a look at the chart below that tracks the Gold-to-Silver ratio over the last 300+ years:
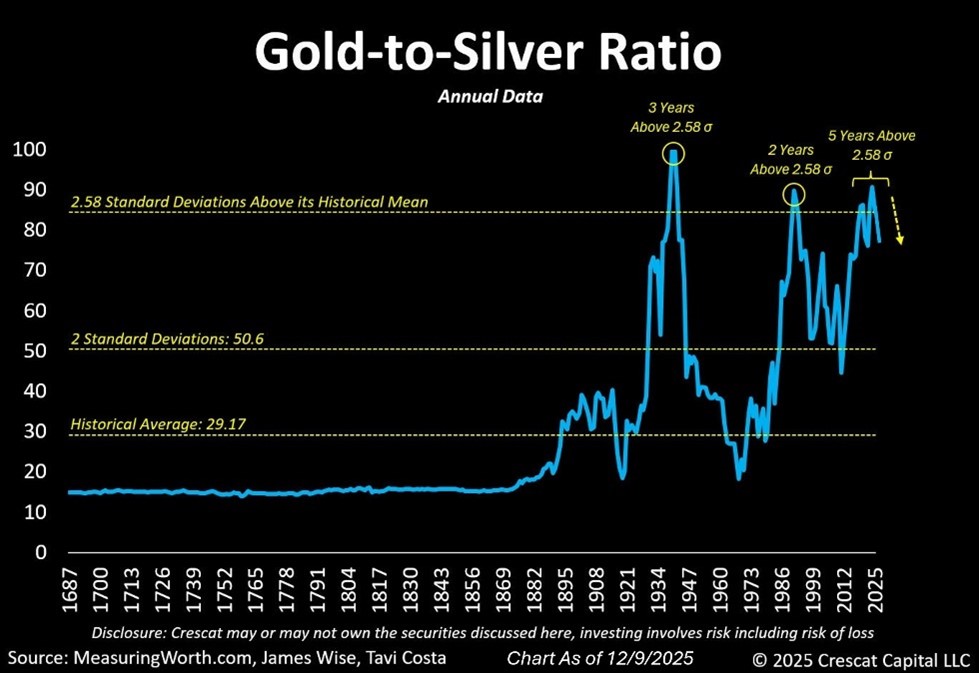
We think the chart above will be reversed, and it will be driven by silver’s price movement. We think there are several technical and fundamental attributes that silver exhibits, which make us bullish on the metal. The market remains in deficit and will continue to do so (driven by inelastic mine supply). Silver’s application continues to increase with new technologies. Silver has also developed an industrial backbone where 59% of demand comes from industrial applications rather than cyclical consumption. Silver also often lags the performance of other precious metals early in a bull cycle but delivers higher returns later in the cycle. We also believe the technical setup for silver is highly attractive today. Our data analysis also points to a much higher technical price target than gold (in terms of % moves from today’s price).
We also think energy commodities could have a strong 2026, which could surprise many investors. Many energy names are being outright ignored by investors who think the sector will be left for dead. We disagree and have been adding exposure to various sub-sectors in the energy space.
Part of our commodity thesis is rooted in our conviction for hard assets due to structural imbalances across the globe and inflationary pressures.
U.S. jobs report
The Bureau of Labor Statistics released November’s job report along with key indicators from October on Tuesday. The BLS has been backlogged since the government shutdown earlier this fall and has been forced to play catch-up. Several figures are expected to be released in the coming weeks from previous months, which will give investors, consumers, and the Federal Reserve some more clarity on economic conditions.
According to the BLS, hiring rose in November more than expected, but so did the unemployment rate, which jumped to 4.6% in November (versus 4.4% in September). November’s unemployment rate was the highest since 2021. November’s jobs report also reflected a surge in part-time working. Part-time employment jumped by 909,000 people from September to November.
Investors should not be highly reactive to this tick up in unemployment, as the number was reportedly primarily driven by teenage unemployment. Omair Sharif, founder of the research firm Inflation Insights, said he would not be surprised if that number reversed course in December due to seasonal job availability.
The labor market certainly does not appear to be collapsing with the recent boost in job openings, receding layoff announcements, and this report from the BLS. However, the part-time worker surge could be worrisome as it’s often a leading indicator of the health of consumers, as consumers turn to part-time employment to address financial worries and stress. The tick up in unemployment is also worrisome. For now, it appears the FED is stuck between a rock and a hard place with a weak labor market and inflation remaining slightly elevated.
The BLS did make it clear that this report should be taken with caution due to lower survey responses, weighting changes, and non-typical lookback periods. This is all due to the government shutdown. According to industry experts, the FED won’t put too much weight on Tuesday’s data. Policymakers will more than likely prioritize December’s jobs reports, which will be released on January 9th.
A few charts to end the year
According to the Bank of America Fund Manager Survey, cash exposure has continued to drop in recent months, reaching 3.3% as of last month, a record low. Fund managers have been forced to add exposure even if they believe markets are frothy due to strong equity markets and demanding LPs.
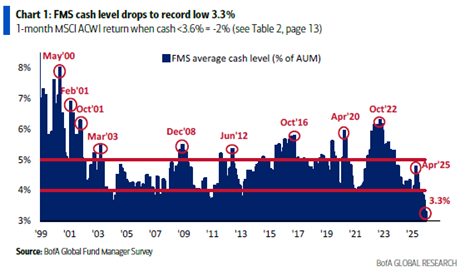
Cash allocation at multi-decade lows often does not happen at market bottoms. We have remained fully invested and hold little cash in our client accounts due to an allocation to our Safe Harbour Fund which protects investor capital during turbulent market drawdowns, something we could see next year.
The second chart that we wanted to share tracks the job market. The chart tracks three-month changes in private payrolls for large firms and small firms. The two trendlines have deviated in recent months and have created a K-shape. The K-shape term has been used by many investors and economists to describe current economic conditions where rich Americans are becoming better off, and poor Americans are seeing economic conditions continue to break down. America’s corporate landscape is taking on the same issues. The relentless profit and stock gains have allowed Wall Street to surge while small businesses on “Main Street” struggle.
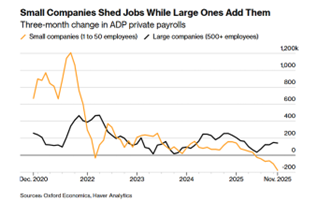
Small companies have been laying workers off due to earnings growth moving lower, bankruptcies ticking up, and loan delinquencies sitting at multi-year highs (for small businesses). The chart above reflects a deeper market system where capital flows toward scalable businesses over small business sustainability. We believe that if this trend continues, the workforce could completely alter in just a few years.
Warner Bros officially pick a dance partner
As expected, Warner Bros leadership made their official choice this week in regard to Paramount’s unsolicited bid for their business. Management does not like the deal and is urging shareholders to reject the offer and opt to stick with the original Netflix deal. Leadership at Warner Bros stated that Paramount has consistently misled shareholders regarding the Ellison family’s financing commitment. According to Warner Bros, the Ellison family has chosen not to backstop the Paramount offer despite Paramount claiming they have unconditional support and financing from the Ellisons. Some investors were already worrying about how Paramount would fund the takeover deal. Jared Kushner’s private-equity firm Affinity Partners had been an equity investor in Paramount’s offer, but it said in a statement on Tuesday that it was no longer involved, according to The Wall Street Journal.
The Warner Bros board is unanimously backing the offer Netflix made two weeks ago. Netflix’s offer gives shareholders of Warner Bros $23.25 in cash, $4.50 in Netflix stock, and additional shares in a spun-out Discovery cable networks business. The Paramount offer was an all-cash offer of $30/share. Warner Bros shares were trading in the low $20s before these offers were made. Shares have moved up steadily this year as buyout rumors have swirled.
We will have to see what shareholders vote for, but for now, it seems like Netflix is the leader in the clubhouse.
Happy Holidays
As we head closer to the holidays, we wanted to wish our readers a safe and happy holiday season. We will be back in the New Year!
The MacNicol & Associates Asset Management team
What We Are Looking At Next Week
Next week will be a shortened holiday trading week with markets closed for Christmas and volumes typically declining. Investors will have time to step away, reconnect with friends and family, and reflect into year end. With the economic calendar largely empty, market action is more likely to reflect seasonal dynamics rather than fresh macro catalysts.
Given this backdrop, any market chatter will likely shift towards whether or not we will get the so-called Santa Claus Rally–the tendency for equities to perform well during the final trading days of December and first few in January. Since 1950, the S&P 500 has shown positive returns in this period about 75% of the time with returns averaging about 1.5%. While not a rule, the pattern has been persistent enough over time to shape expectations and positioning, particularly when markets enter the period without major unresolved shocks. In low-liquidity environments, even modest buying pressure can have an outsized impact on prices, reinforcing the seasonal narrative.
From our perspective, the significance of next week lies less in any single data point and more in how markets behave in the absence of one. Holiday trading conditions can amplify both upside momentum and downside air pockets, making year-end moves appear more decisive than they ultimately are. How markets respond in this thin, seasonal window will help frame expectations for positioning, sentiment, and follow-through as we move into the first full trading weeks of the new year.
MacNicol & Associates Asset Management
December 19th, 2025
Download in PDF format: