

MacNicol’s Monthly Market Update is a roundup of the financial market performance as impacted by global business, economic, and political events. An update on MacNicol’s Alternative Asset Trust is also highlighted in this issue.
Disclaimer: Information and opinions presented are based on data available as of the date of presentation. No equity recommendations are given in this commentary, and we encourage you to contact us if you have questions regarding any observations. Check the full disclaimer here.
Market Updates:
Looking at the S&P, we saw a rally at the end of April which created a nice Buy Signal, the third straight. We saw some nice consistent buy signals there and then also off the bottom in October where it created three straights. It remains substantially above the positive trend line, and it’s got a nice support line. However, it didn’t get above the resistance line in February and March. We are yet to see a cell signal, but it may have some weaknesses later on.
The S&P TSX60, on the other hand, had a little weakness in the first week of May, which led to its first cell signal since March when it created three straights. The volatility and trading commodities are higher than in other equity markets, so we should not worry much about one week swing. However, it has two resistance lines at 1255 and 1250 that it hasn’t been able to get above. The only issue with the TSX60 is that the support lines are 15 boxes lower than they currently sit. We would like a nice reverse, and then it would have some nice support in this range.
Finally, everyone is familiar with VIX. We have seen some spikes up, but the overall trend this past month has been a reduction. One thing to watch is the price target which has reversed up to 26. We do like that it’s below the negative trend line. It might be a poor sign for any stock or ETF but for volatility, we want to see that negative trend.
Alternative Asset Trust Fund:
Everyone has a lot of concerns in the marketplace, but Florida is not one of them. Not yet anyway. Most of the major markets in Florida are performing quite dramatically ahead of the overall United States.
A number of the office assets that we have in the Trust are predominantly clustered in Florida as well as a few other markets. That said, the office market is not a big area for us but those that we hold in the fund are performing quite well than what the media is talking about.
Additionally, a quick view of the jobs recovery by the industry groups in Florida shows that financial services and professional services are leading the way. There is also quite an immigration of professionals with incomes of over $200K coming in and settling in the state. Of course, that means an increased demand for houses and office spaces so real estate is not going away, at least not in this state.
In addition to the above updates, one of our other real estate partners did an excellent job of an overall global analysis of markets. This is the solar manufacturing share of global capacity. If you follow protectionism storylines, one of the major ones is obviously the states in China, getting their noses out of joint in relation to chips, semiconductors, and those sorts of things. One of the things China is trying to do now is put the clamp on solar manufacturing, but they might want to rethink that one because the states have a very strong background in that area.
There were also a lot of discussions about crude oil consumption over the past quarter. What’s driving this longer-term global view of rising oil consumption is this petrochemical organization chart. It gives us a sense of the overall value creation chain from crude oil, showing us a whole range of potential growth areas for oil and gas.
In recent years, the United States has been placing a greater emphasis on Mexico as a trading partner, at the expense of China. The graph below clearly shows how the US import business is shifting away from China and towards Mexico.
Charts of the Month:
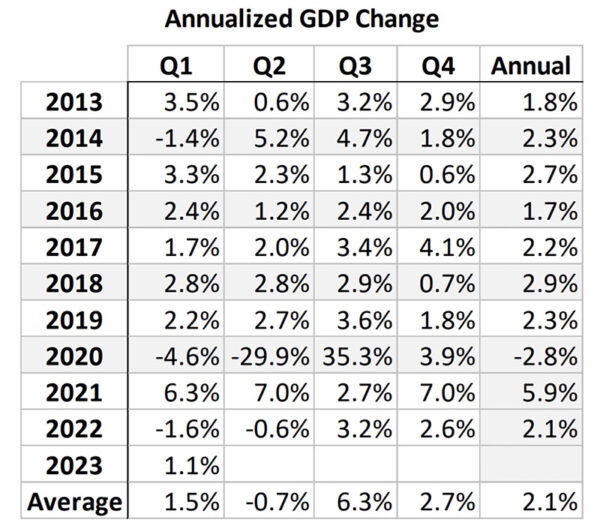
US GDP showed a slight reduction in the first quarter of the year. This is not surprising, as it is in line with the goals of central bankers who aim to control inflation and stabilize the economy. It is important to keep an eye on these trends and to be aware of the potential impact they could have on the markets.
Finally, analyzing one of our Charts of the Week, the width of the green bar shows the duration of the first interest rate cut to the last one. Here’s what it’s showing us: you can’t just take a pause and view it as an overall signal to go back into the markets. There’s a bit of a lag here. You still need to be careful. You still have to be cautious. You still need to be tactical and selective with your investments.

And that’s a wrap! If you have any specific questions about your portfolio or securities you own or want them, feel free to shoot us an email or shoot any one of us on the call an email. Stay safe and healthy, and we’ll see you again next month.
Looking for more content like this? Sign up to MacNicol’s Market Insights and get access to our library of financial market events and commentaries.