

Summer came and went by quickly, and we felt the same turn of events happen with the market – rapid changes with a significant impact on our lives.
In this issue, our team will provide an update for our 360-Degree Fund and share the market events that transpired in September.
Before we dive into the details, please read our disclosure here.
Alternative Asset Updates – Real Estate
The Fairmont Hotel

Source: Fairmont.com/Seattle
Located in the beautiful city of Seattle, this is one of the few hotels we own in the fund.
The Fairmont is a 450-room hotel with 28,300 sq ft of retail space. Although demand remains below pre-pandemic levels, hotel occupancy has improved significantly from approximately 34.1% in 2021 to approximately 65.1% in 2022 and decreased slightly to 60.6% in the second quarter of 2023, with the second quarter of 2023 average occupancy being 68.1%.
For the first half of 2023, the hotel’s average daily rate was $270.18, or 5.1% ahead of the second quarter of 2019 and 3.6% ahead of the second quarter of 2022.
The Fairmont Olympic has been an excellent cash flow generator having generated $22.5 million in distribution, $12.8 million in operating distributions, and $9.7 million in financing distributions inception to date, resulting in a return of 91% of capital invested through operating cash flow.
The Fairmont Olympic is financed with a $62.5 million loan (50.5% loan-to-value) that matures in December 2024.
South Coast Collection – Retail Outlet
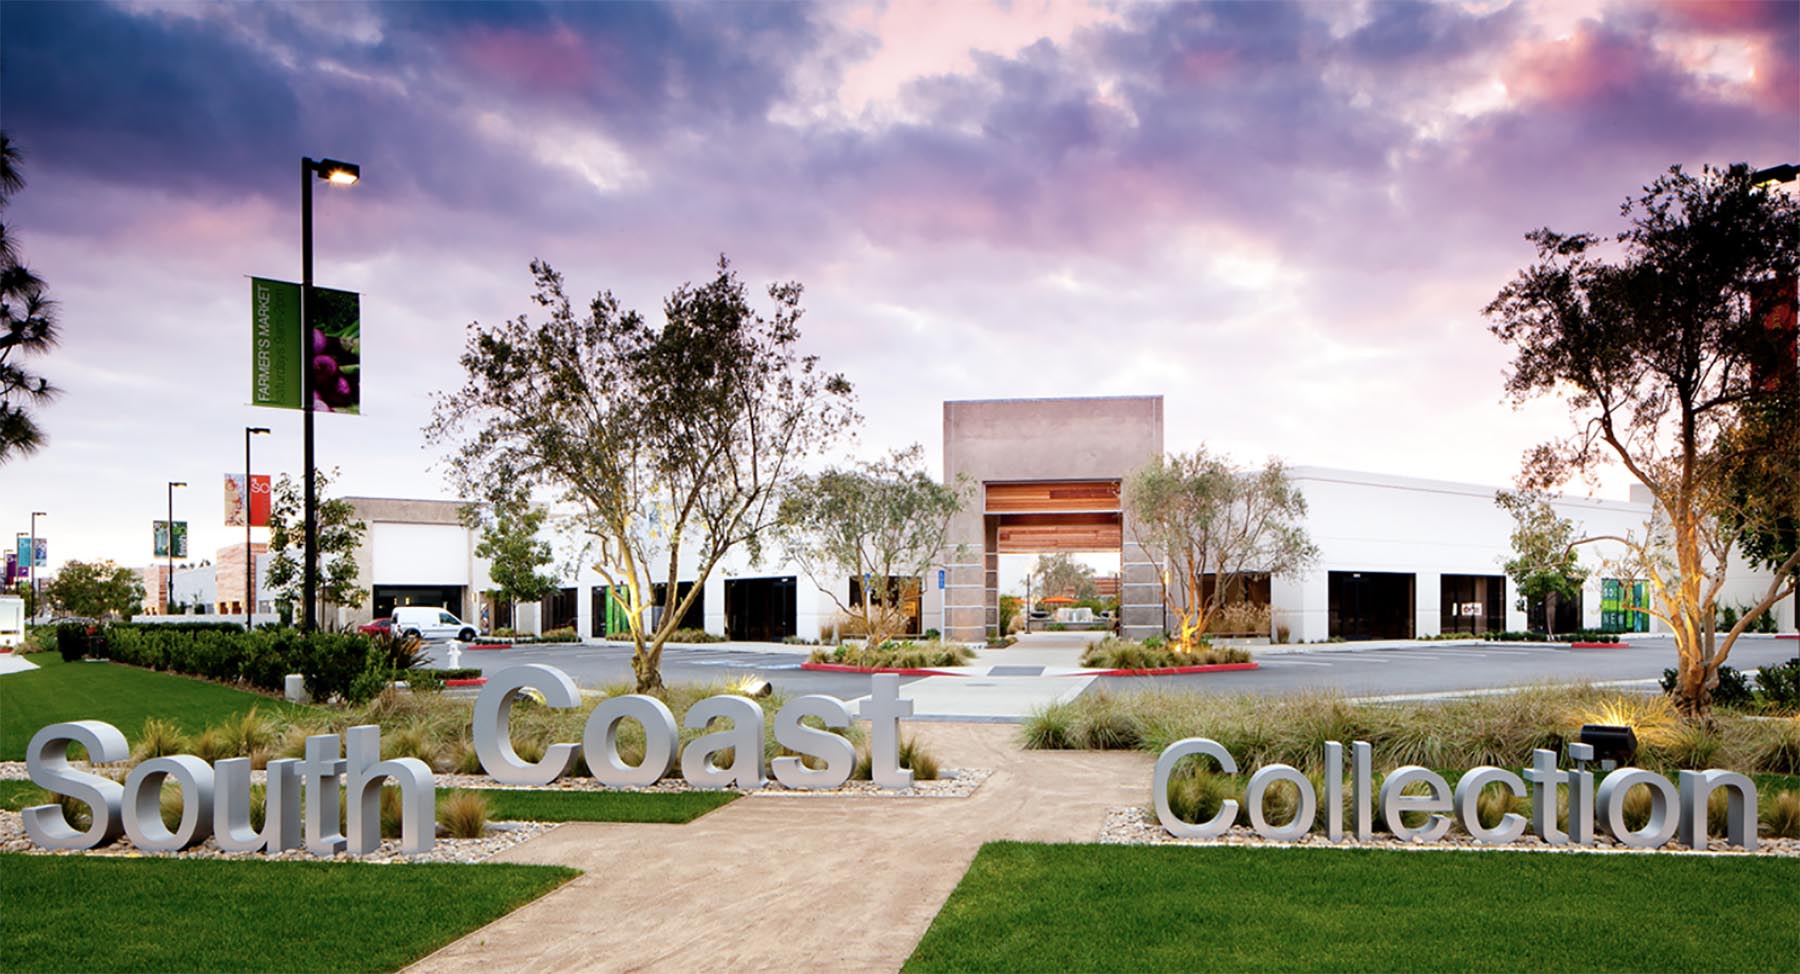
Source: Ware Malcomb
This is a 300,863 sq ft, 94% leased, regional retail outlet in Costa Mesa, California.
While all tenant operations were strained by the interim pandemic shutdowns, collections quickly improved, and occupancy has remained very high throughout the 360 Degree Fund’s period of ownership. As a result, this investment has continued to be an excellent cash flow generator for the fund during these uncertain times.
South Coast Collection has generated $25.2 million in operation distributions inception to date, resulting in a return of 47% of capital invested through operating cash flow. The property generated $7.6million of NOI in 2022, which was approximately $438,000 or 6% ahead of budget.
Year-to-date, the property generated $4.3million of NOI and is projected to trend to $9.3 million through 2023 as rent abatement from recently commenced leases burns off. Coco Republic, an Australian-based interior design and furniture retail brand founded in 1979, is an example as they toolk occupancy and commenced theur 130-month lease for 42,162 sq ft space while completing their tenant improvements.
The Cannery – Mixed-Use Asset
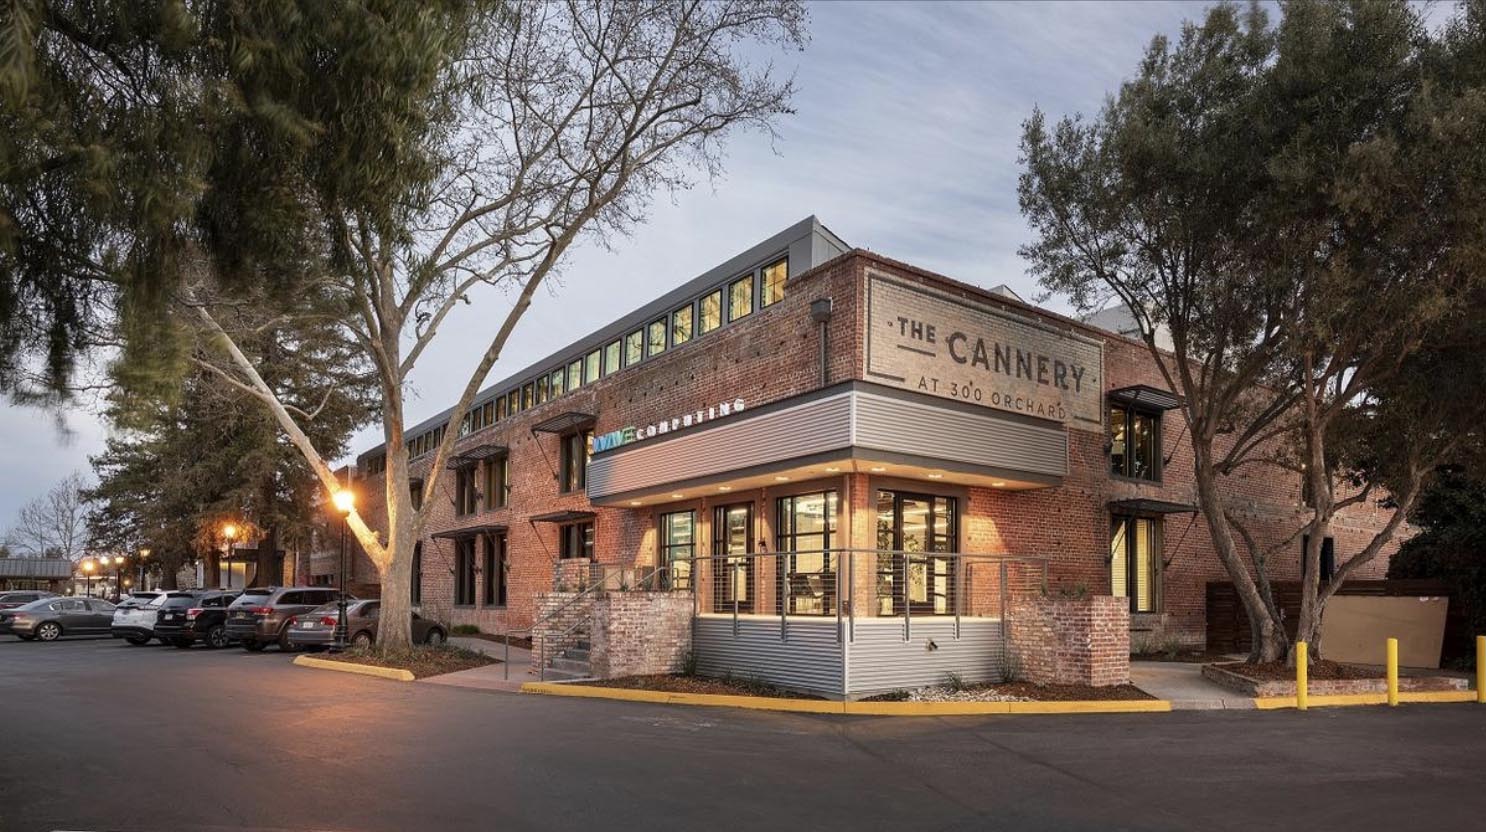
Source: The Business Journals
This is a 100,421 sq ft, fully renovated, creative office campus located in Campbell, California, which was 40% leased as of the second quarter of 2023.
In October, we executed a 12,867 sq ft, 64-month lease with a software company. The largest vacant suite at the property is 40,847 sq ft, 39.2% of the net rentable area and 65.3% of the total property vacancy.
It is in excellent condition having been fully built-out as creative office space by the prior tenant who occupied the premises for only a short period of time, making it potentially turnkey for a new tenant
These assets clearly show that our portfolio is not heavily leveraged in hotels or office spaces, but rather diverse, with a small representation in different sectors. Despite market fluctuations and challenges, these assets have been resilient.
Public Market Analysis
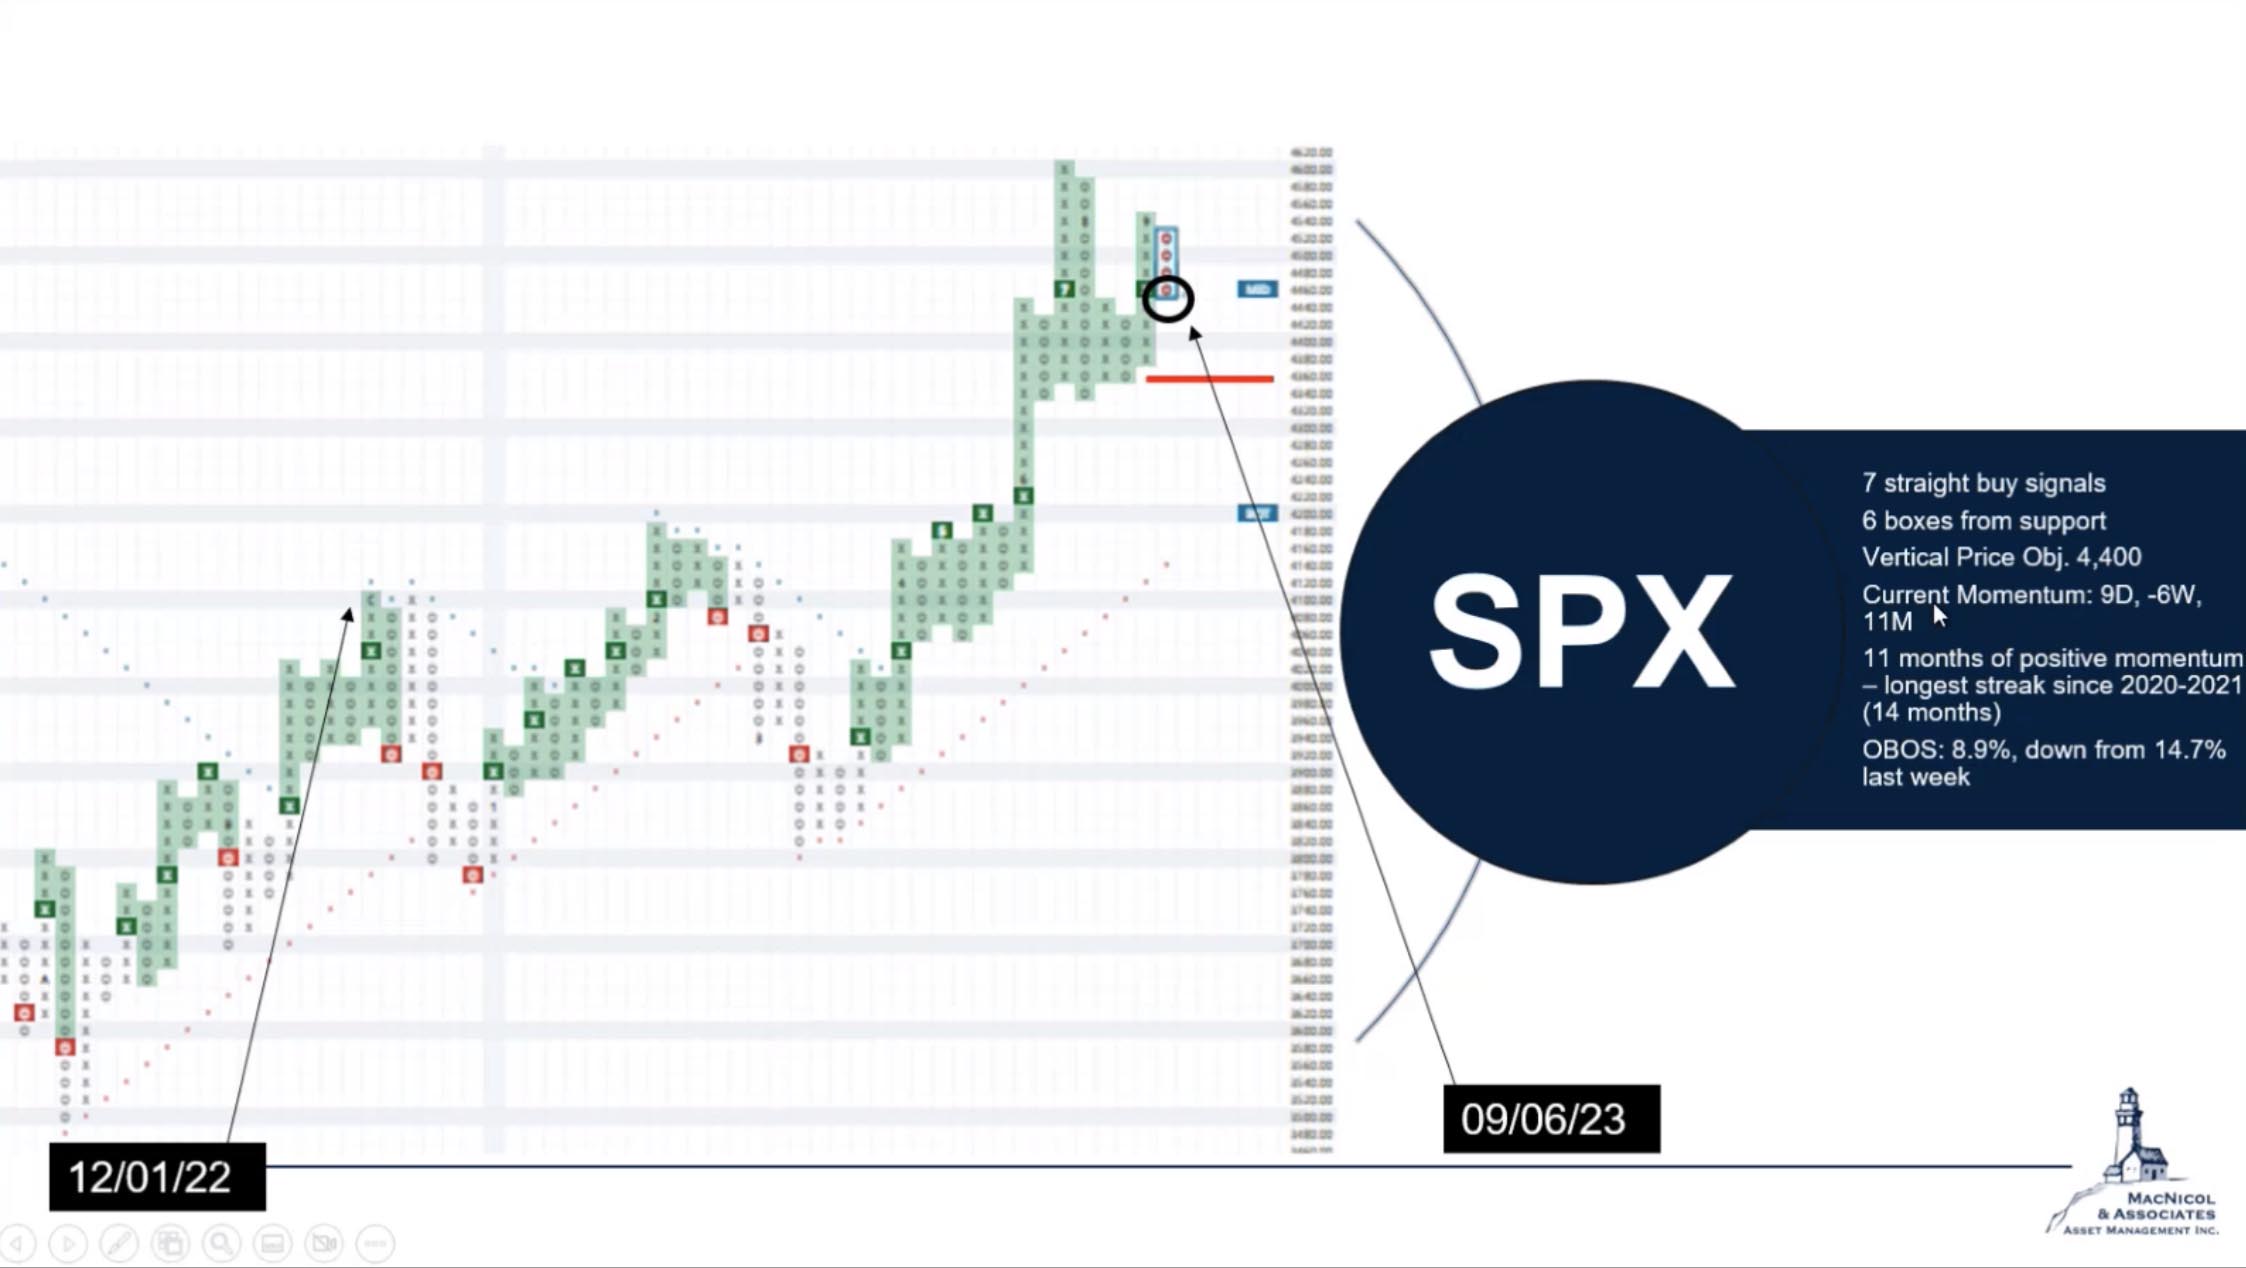
S&P500
The S&P has shown impressive performance this year with a positive trend line. There are seven straight buy signals that it’s had since March and April time frame. However, it is important to watch the support levels (shown as the solid red line in the chart), as a significant drop could change the trend to negative.
Another thing to take note of is the 11 months of positive momentum in a row, which is the longest streak since 2020 and 2021. This sustained, positive momentum could be something that’s peaking, and could eventually turn. We’ll continue to monitor this throughout the rest of the year.
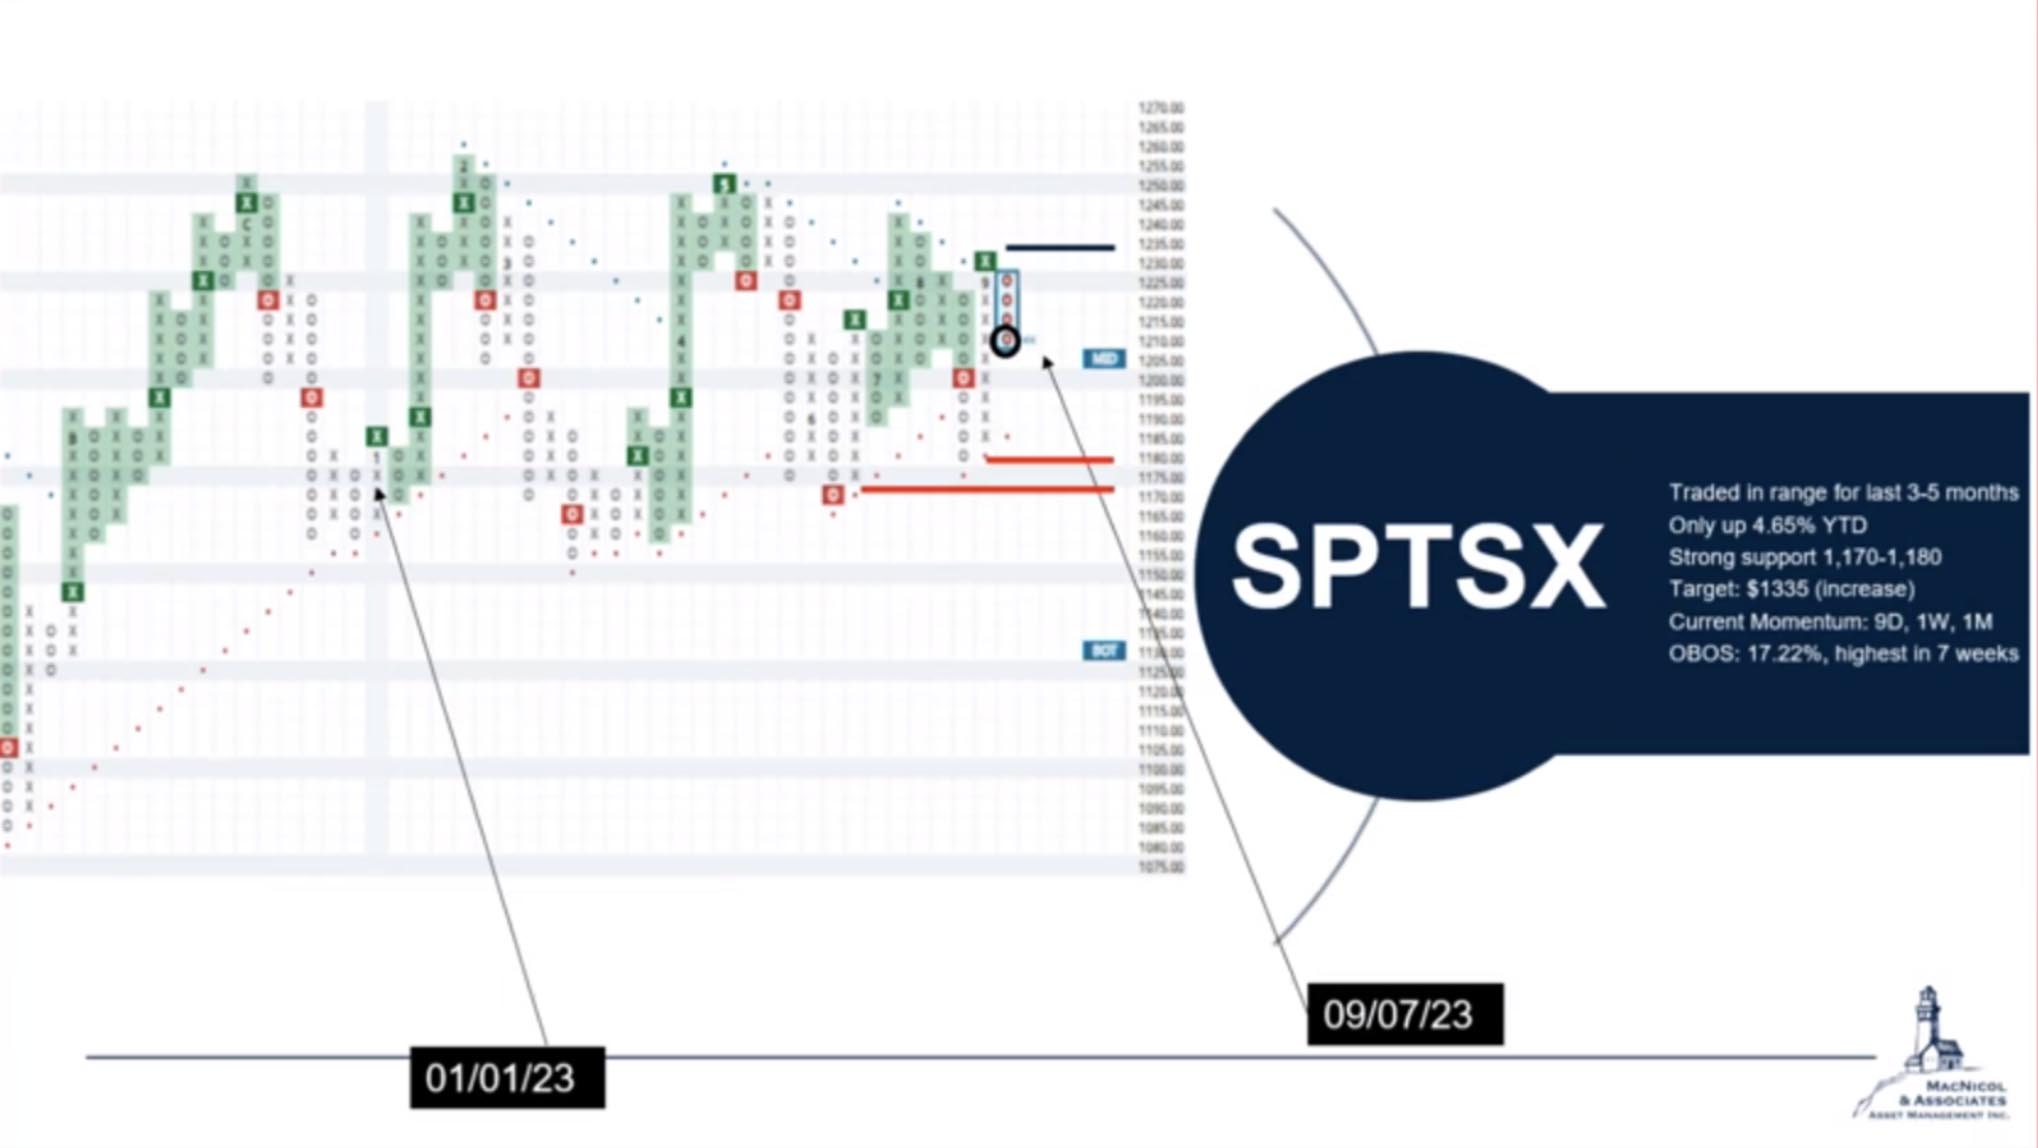
TSX60
The TSX, while showing less growth than the S&P, has demonstrated stability. It’s still up 4% and has traded in this range all year. Breaking above certain resistance levels could lead to significant upside potential. There are a lot of resistance lines above it right now, but it also has a lot of support lines.
We continue to monitor this index as certain commodity prices are heating up.
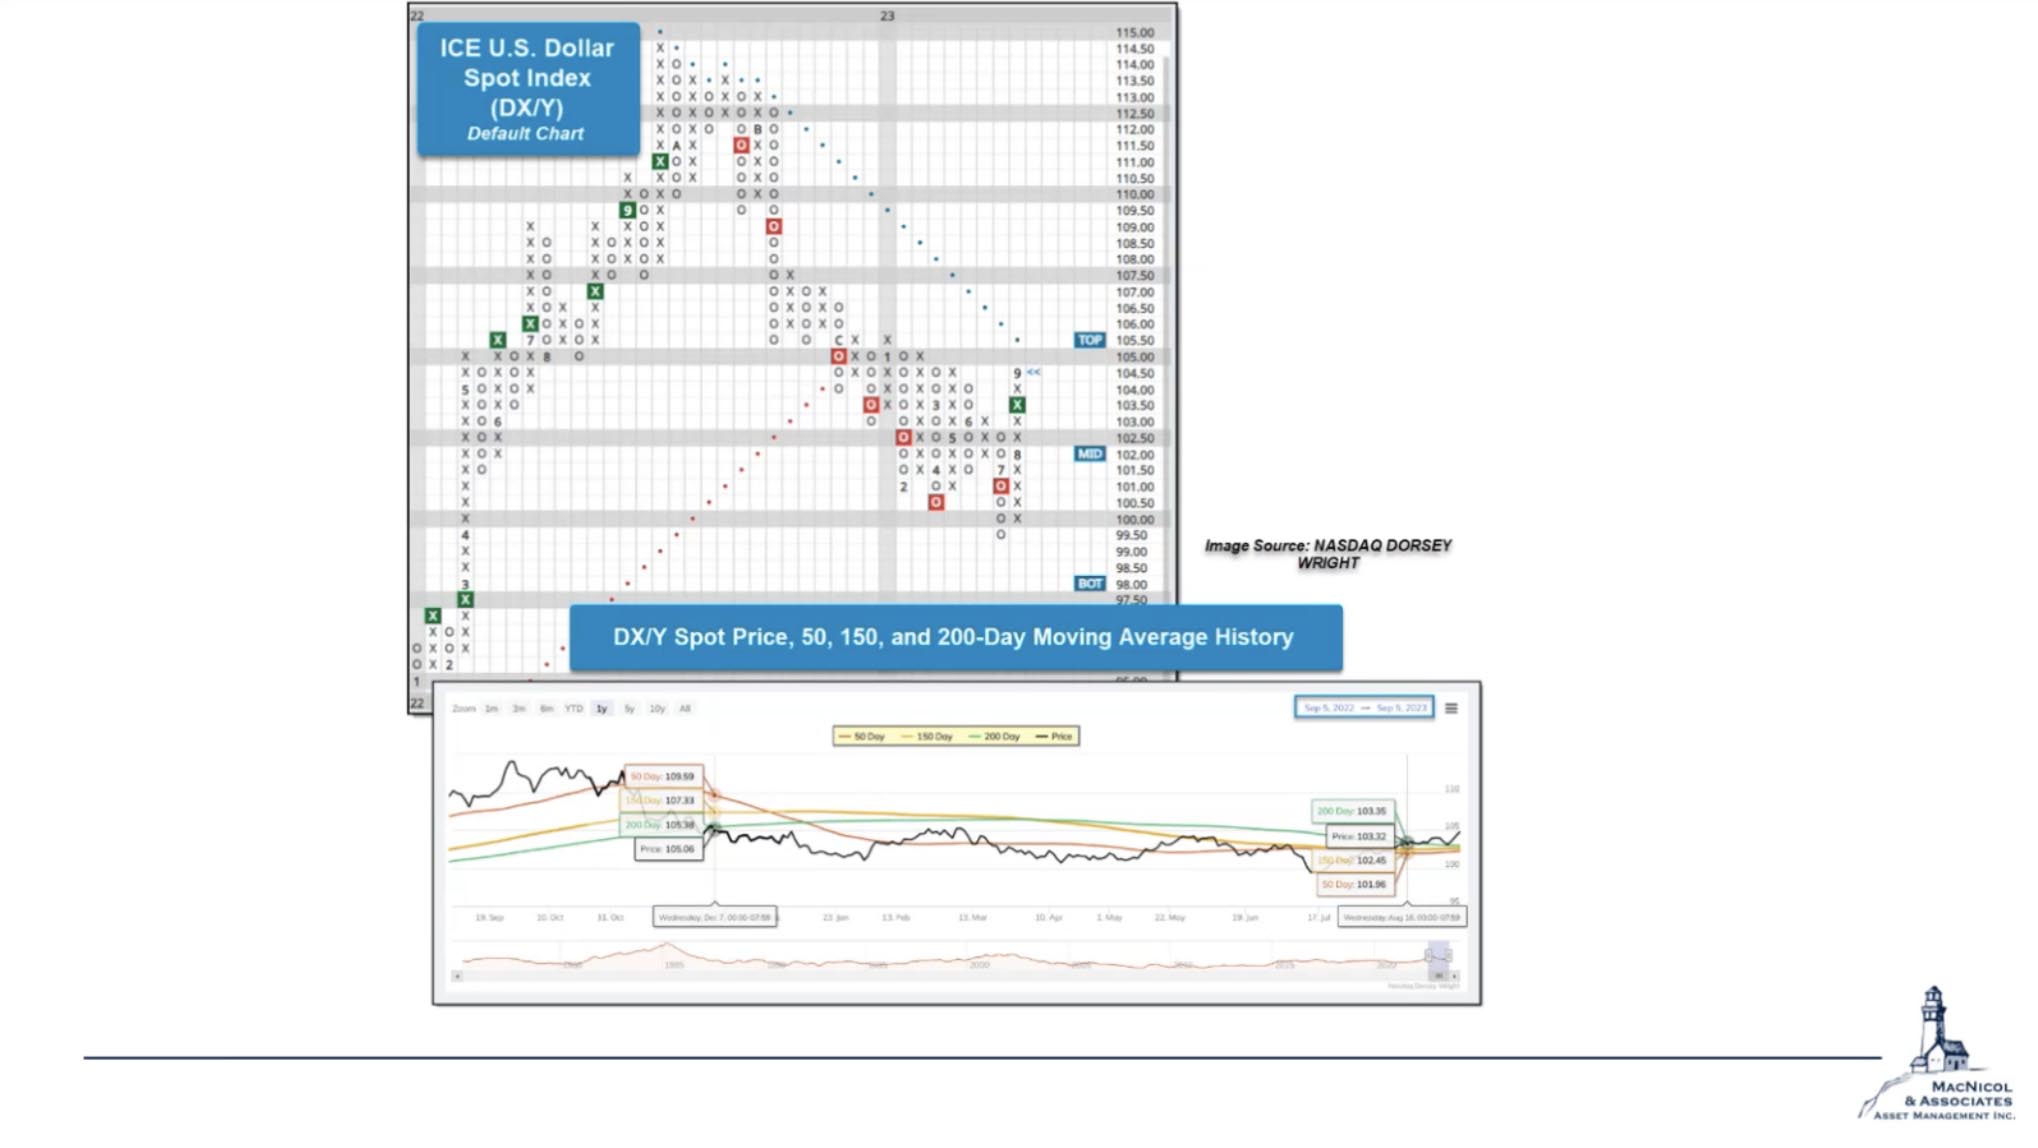
US Dollar Strength
The charts below show the US dollar’s performance against a basket of global currencies. After a year of weakness, it recently displayed a buy signal, indicating potential strength against other currencies. This development can have implications for investments denominated in US dollars.
One thing to watch is the potential breakthrough of the blue trend line (shown in the chart below). If this occurs, it will signal a positive outlook for the US dollar relative to other major global currencies.
Crude Oil and Energy Sector
Crude oil has seen substantial growth in recent months, reflecting changes in the market. The left side of the chart represents crude oil, specifically the spot price of crude oil.
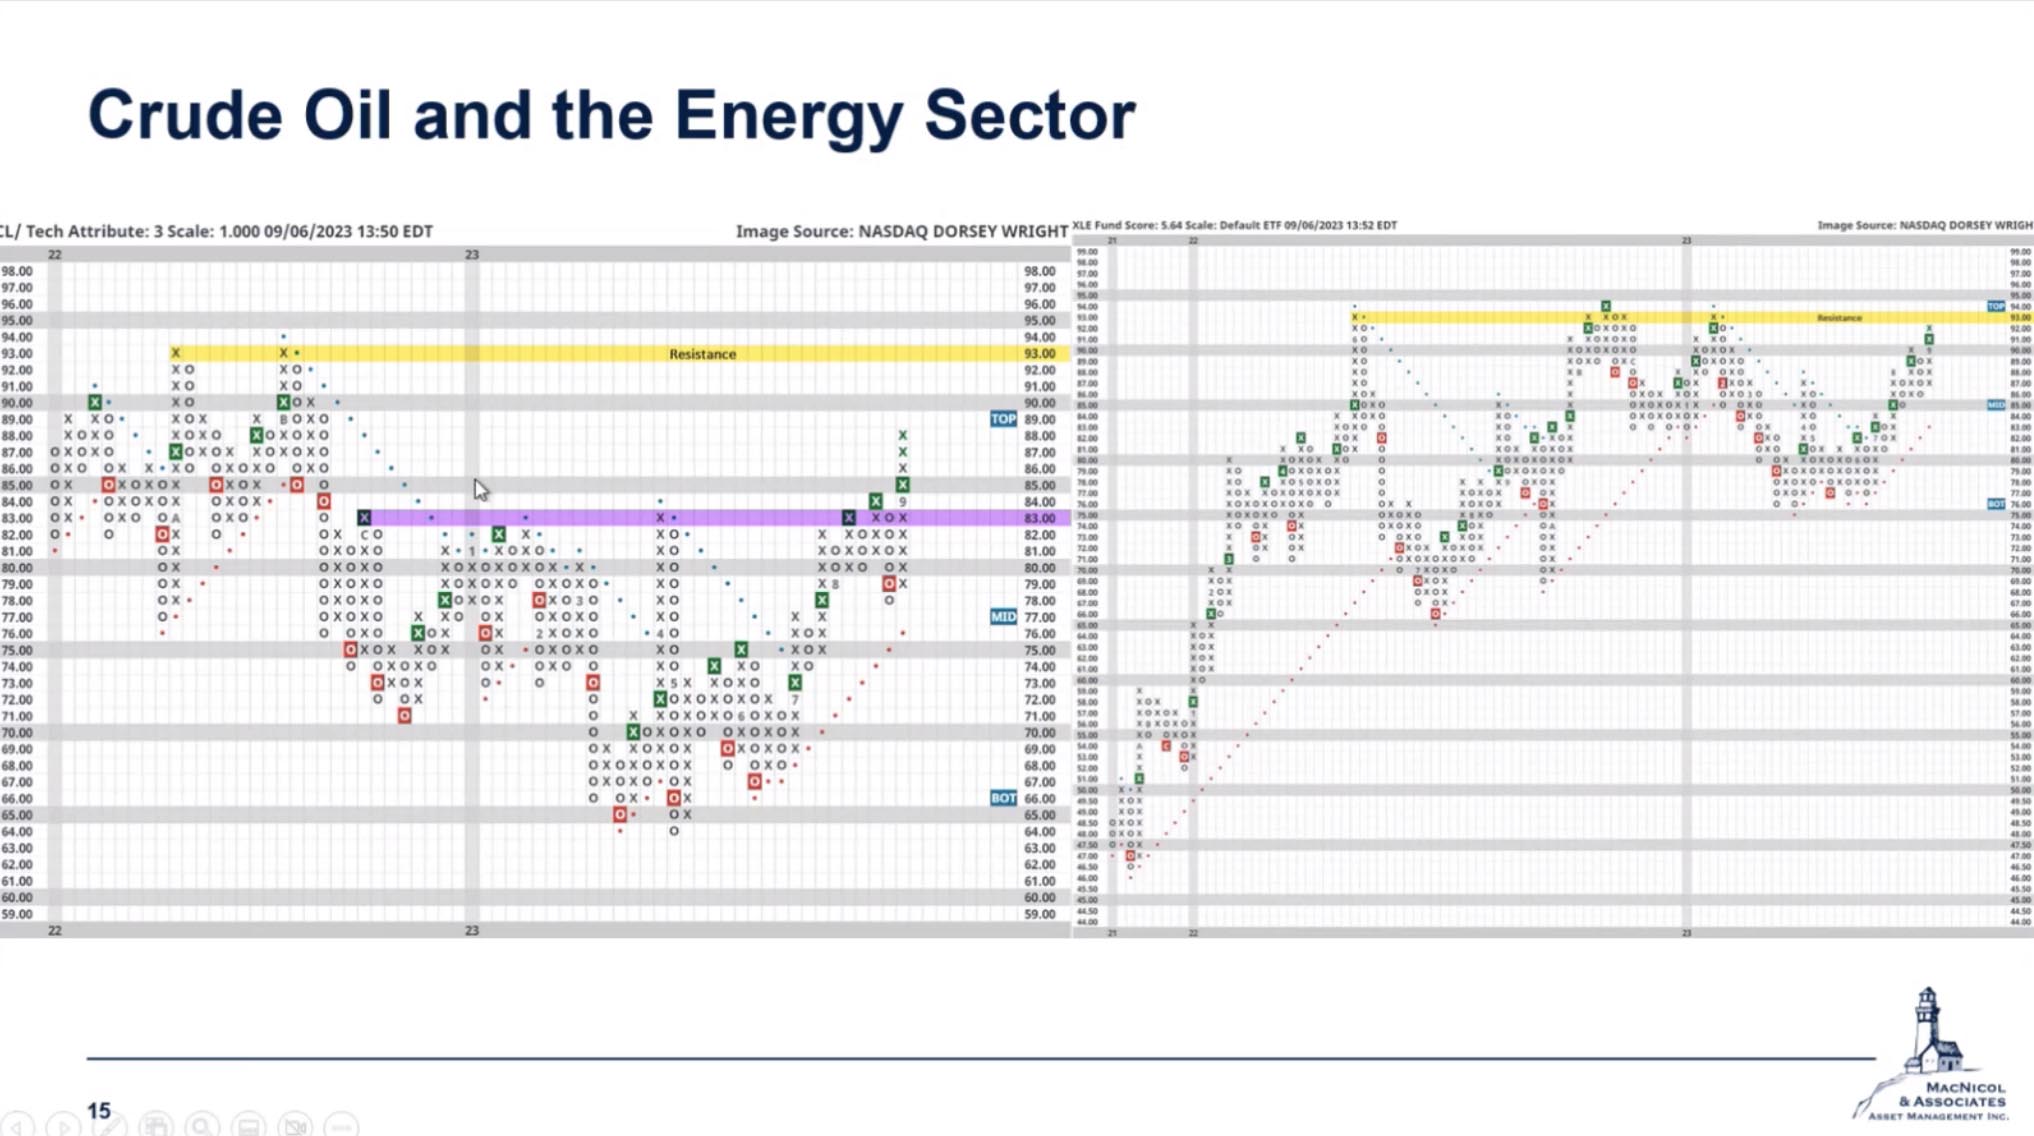
We want to draw your attention to the XLE, an energy exchange-traded fund (ETF) that serves as a representative of the broader energy sector. What’s significant here is the breakthrough above the purple line on the chart (as shown above). This breakthrough is important because it hadn’t occurred in approximately 9 to 10 months, but it finally happened in early September. We’re closely monitoring the macroeconomic narrative surrounding the oil market.
The physical market for oil remains notably tight, driven in part by ongoing cuts by OPEC. Additionally, the strategic petroleum reserves have been tapped to their limits over the past year. While these reserves initially helped alleviate consumer concerns about rising gas and energy prices, their impact was temporary.
Now, we anticipate energy prices to rise, which is evident at the gas pump. Despite various concerns, we maintain a positive outlook on the energy sector since it offers substantial upside potential.
Referencing back to the chart above, we’re closely watching the $93 price range, indicated by the yellow line, which has historically served as a resistance level. If we witness a sustained breakout above this level, it could signal a bullish trend in the midterm. However, it’s crucial to remember that the energy sector is inherently linked to commodities and, as such, can exhibit significant volatility. While challenges and uncertainties exist, recent data shows that oil has experienced a considerable upward trajectory over the past two to three months, with an impressive 35% increase from mid-June to the present.
As we move further into 2023, we encourage you to stay informed and adapt your investment strategies as needed. The market is dynamic, and being well-informed is key to making sound financial decisions.
Our team meets weekly to delve deeper into the latest market events. If you’d like to receive our longer version updates, you may register for free through this link.
Here’s to a successful year ahead!