

In this issue: News about the improved performance of long-term yields, Evergrande still in the headlines, and rumors of stagflation.
Get the big picture of the market and insights into where it’s headed.
Here’s the October issue of our Monthly Market Update.
But before we dive into the details, please be sure to reach out to us if you have any questions. Remember, it’s crucial not to make significant financial decisions solely based on this information alone.
Read our full disclosure here.
Now, let’s get on with this month’s market analysis for advisors and investors.
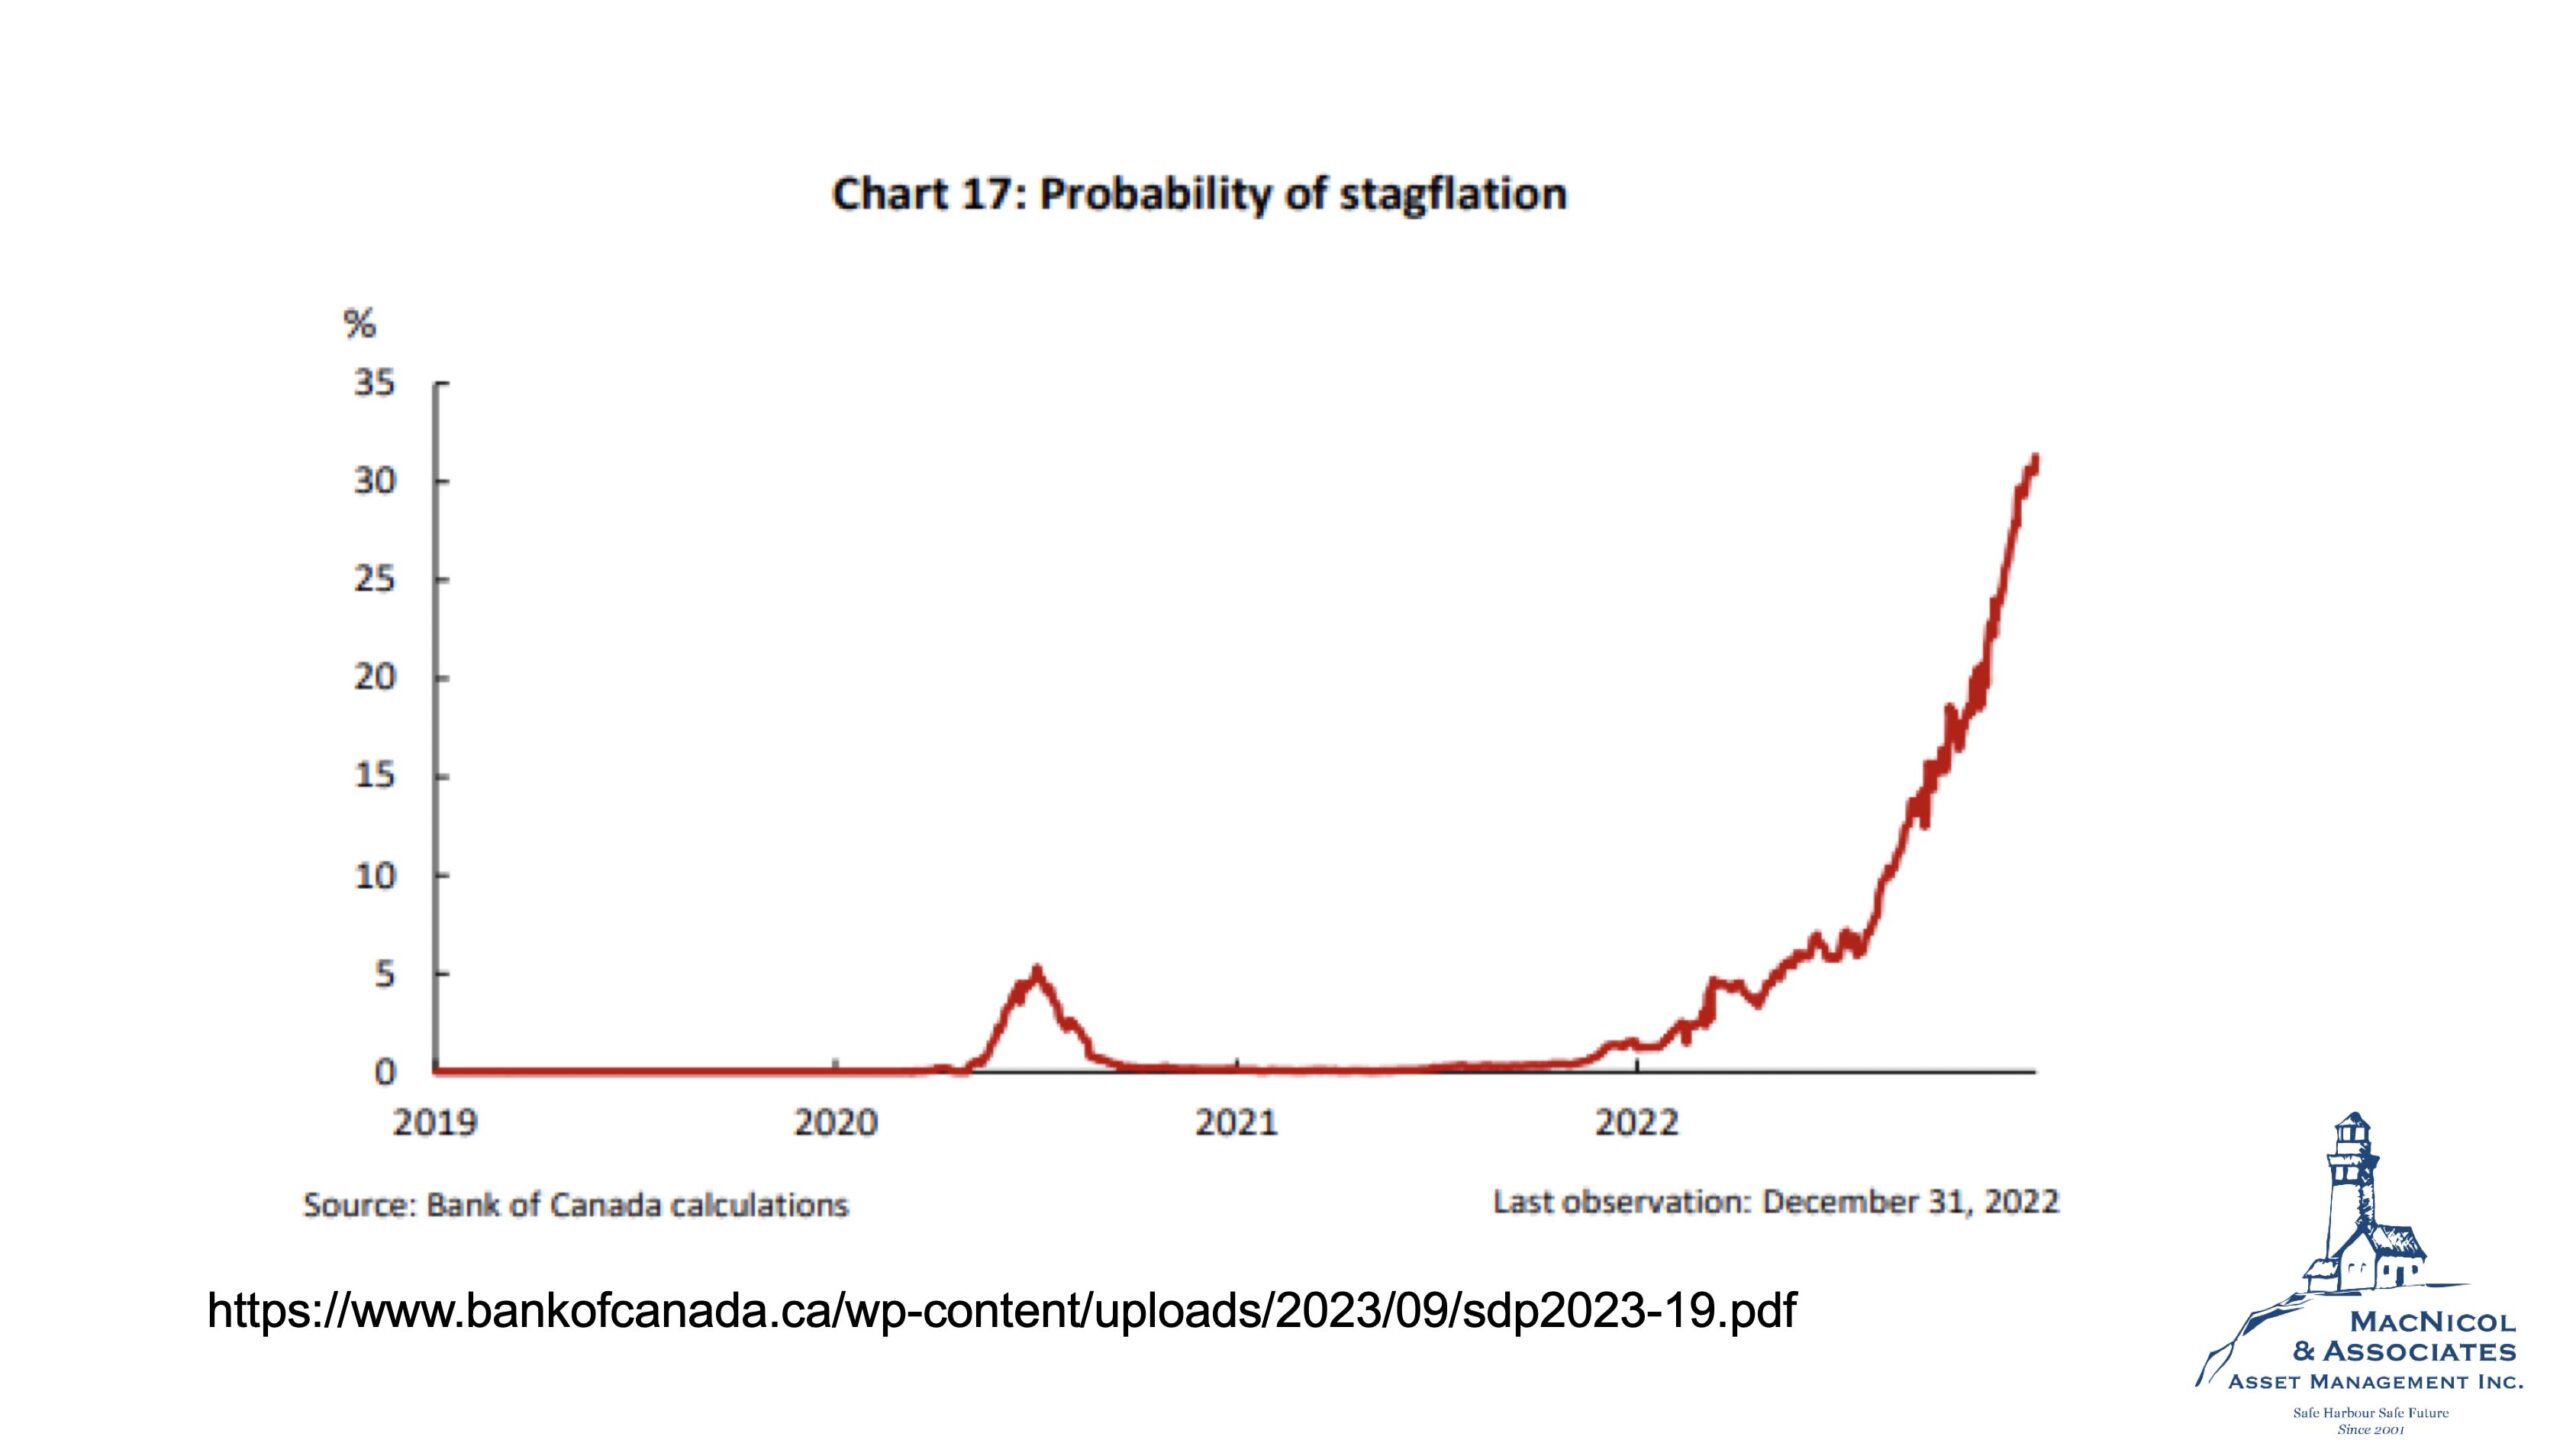
Stagflation Probabilities on the Rise
The Bank of Canada recently released a report indicating that the probability of stagflation is currently around 35%, a level not seen since the 1980s. Stagflation is a period of high inflation coupled with low economic growth. It can have adverse effects on the economy, leading to job losses and higher consumer costs.
Real Estate Trends in Toronto and Vancouver
Turning to real estate, the graph below is from UBS’ report. UBS assessed the valuation of the 25 largest cities worldwide to see if they are in bubble territory, overvalued territory, fairly valued territory, or depressed.
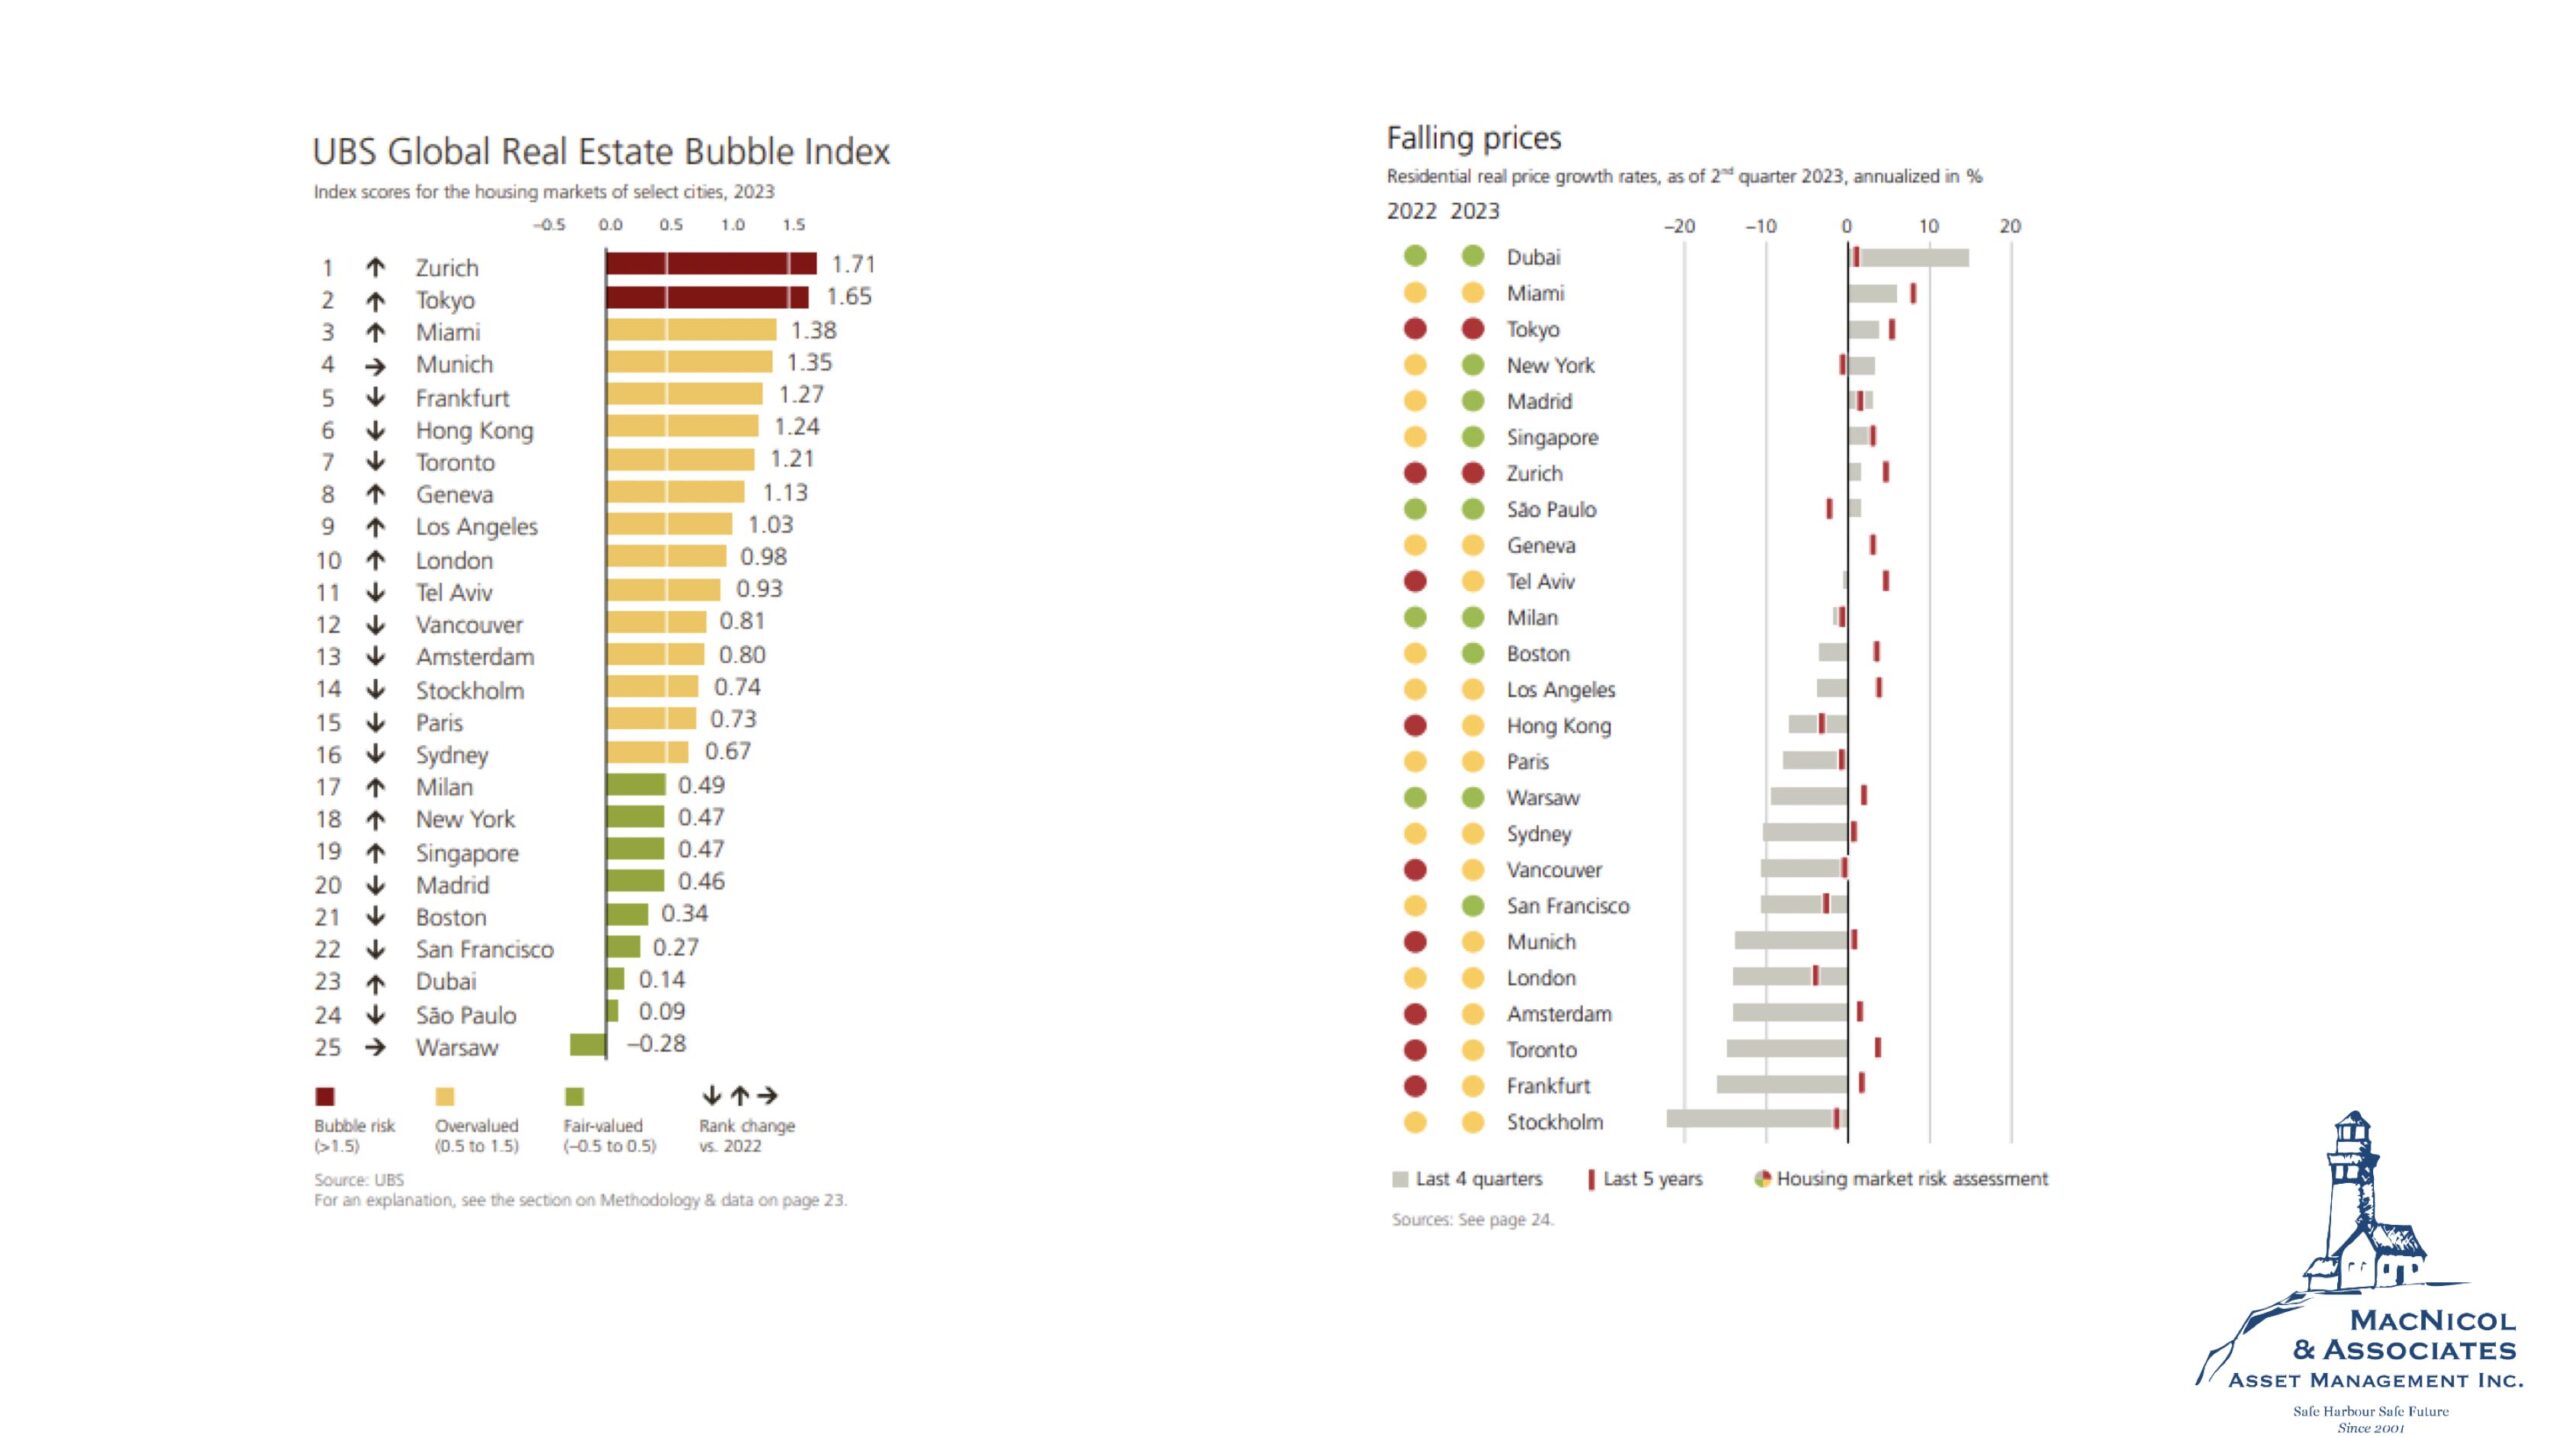
Something notable in the report is how Toronto and Vancouver have transitioned from being considered in a “bubble territory” down to “overvalued territory.” For Canadian financial advisors and anyone who has a stake in the Canadian real estate market, this is an important turnaround. This change reflects a decrease in real estate prices of 10-15% since their peak in 2021. However, rental rates continue to rise resulting in cap rate expansion.
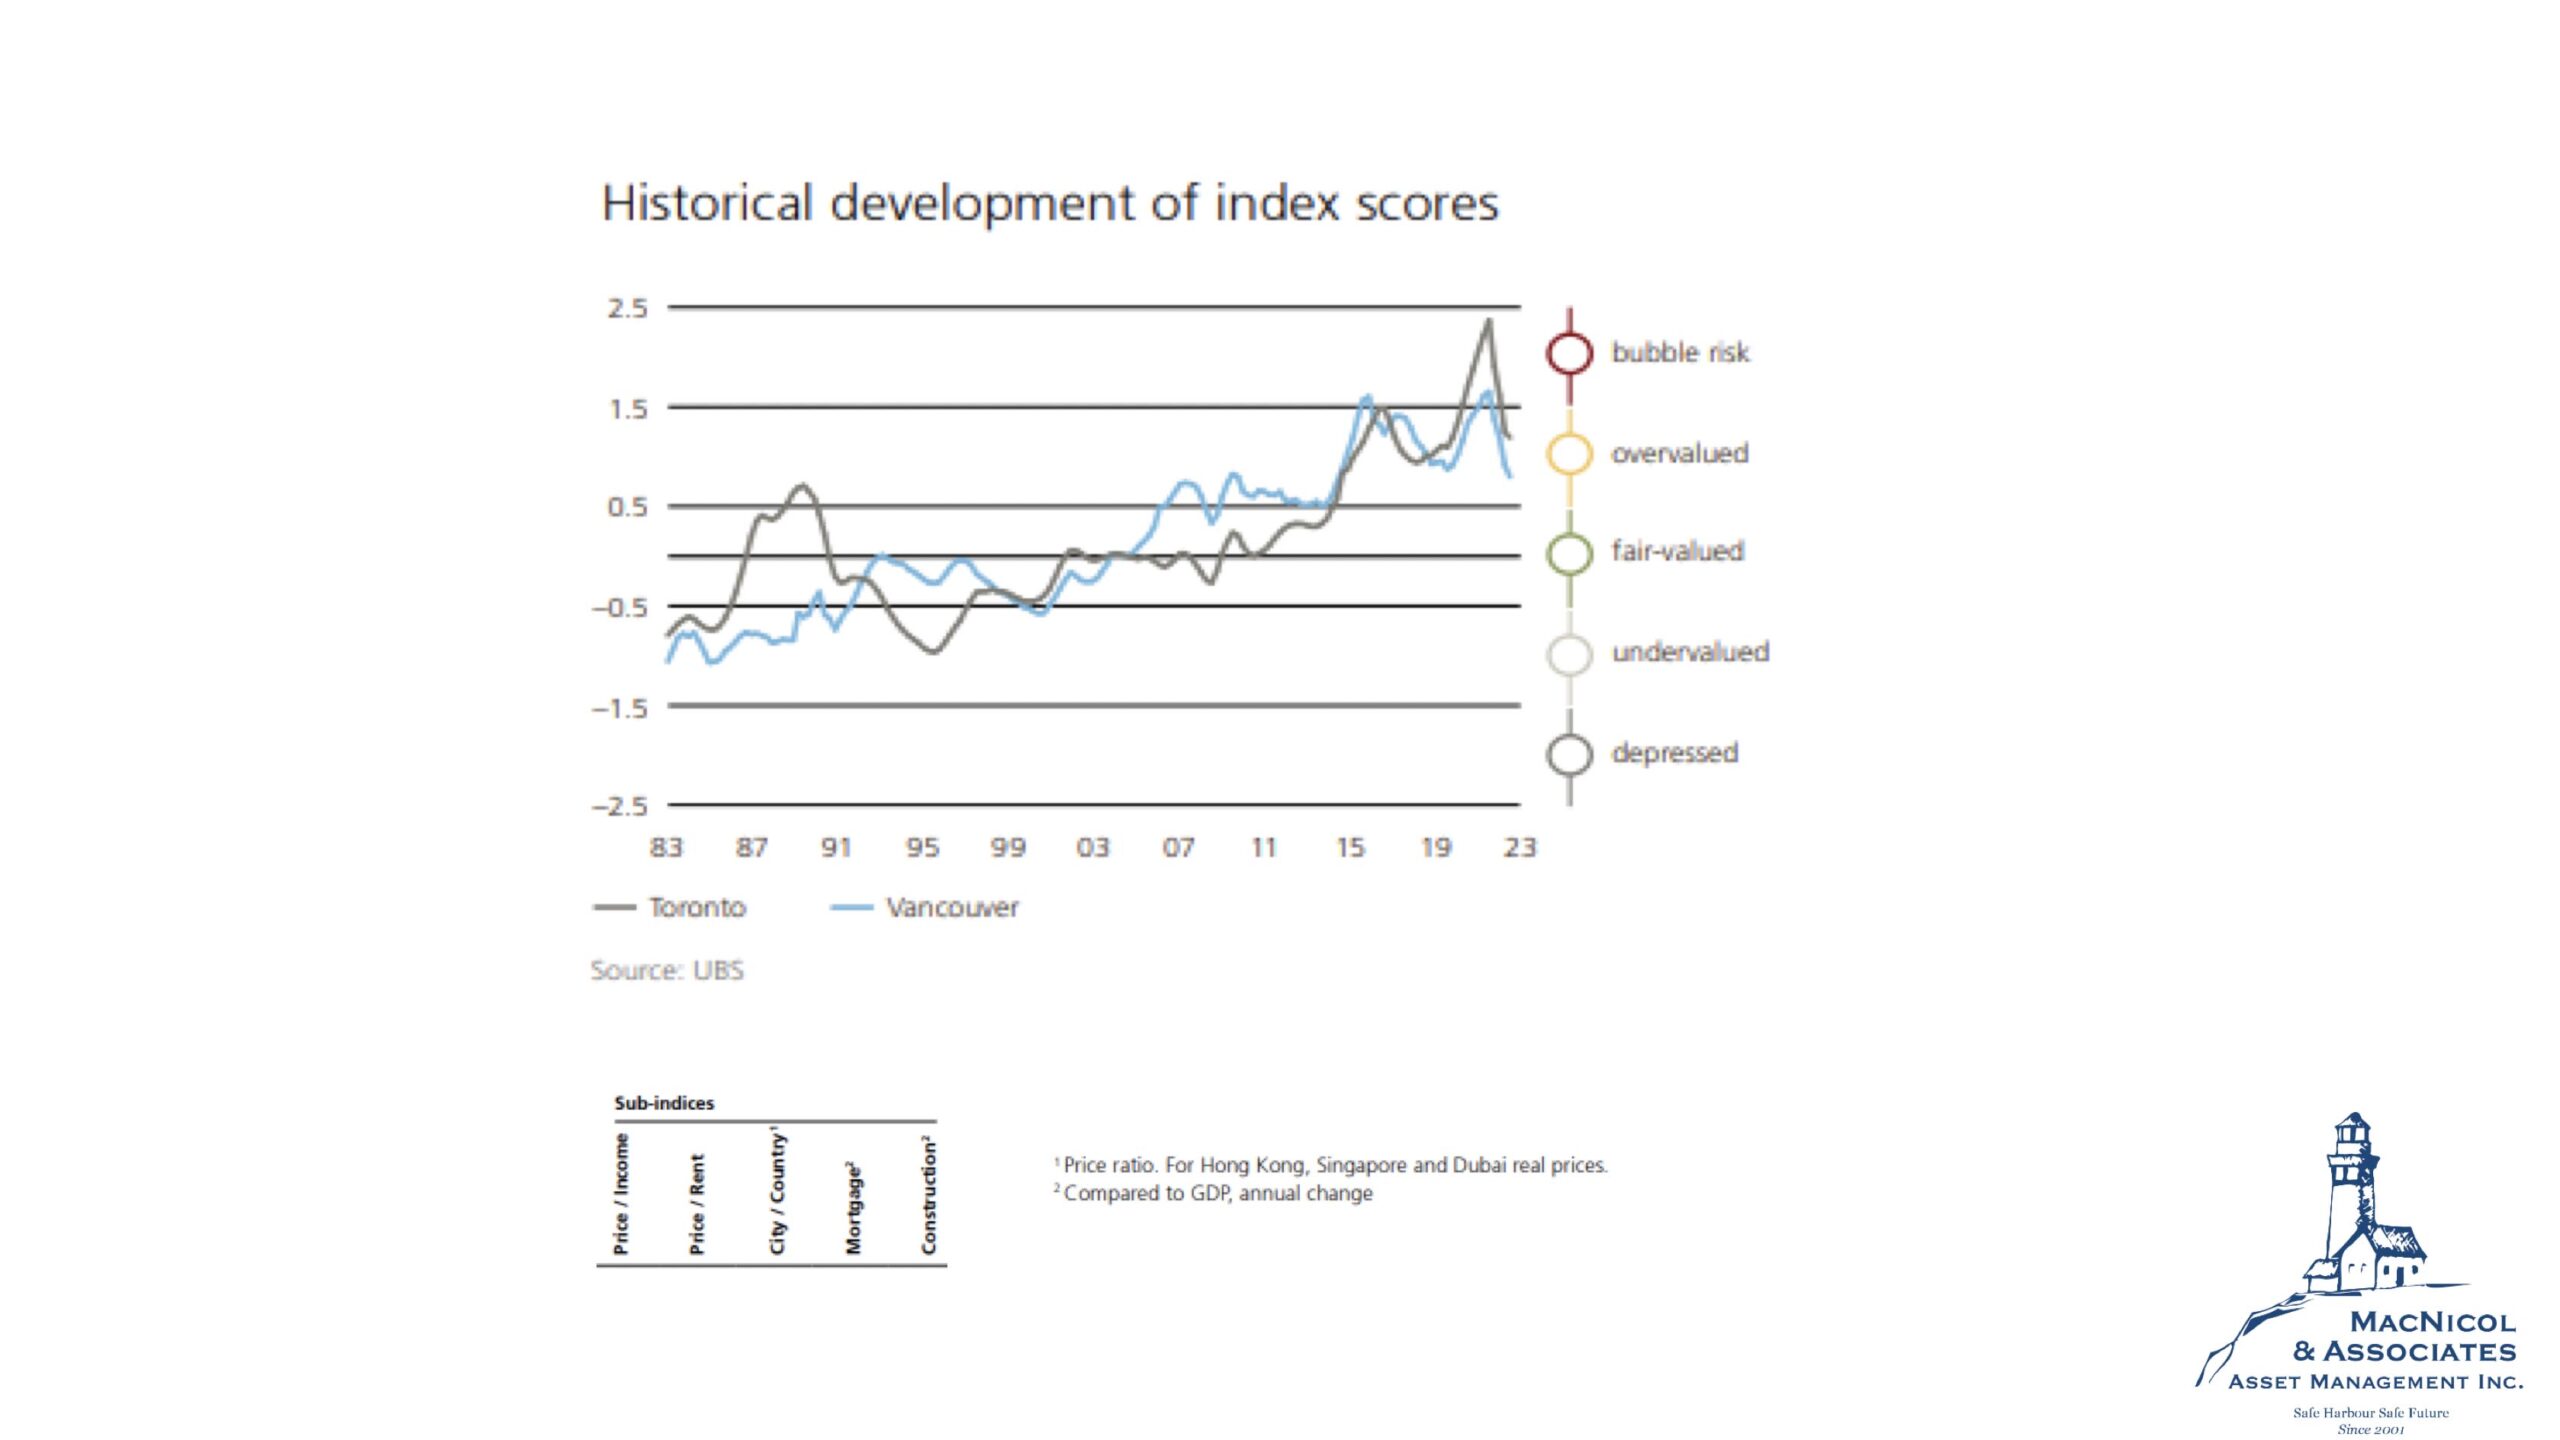
If we zoom out a bit, we can see that over the past four decades, Toronto and Vancouver real estate markets have shifted from being below fairly valued to reaching bubble territory in 2021. The recent correction is significant enough to bring the market down from bubble territory to an overvalued territory which, for investors, mitigates downside risks.
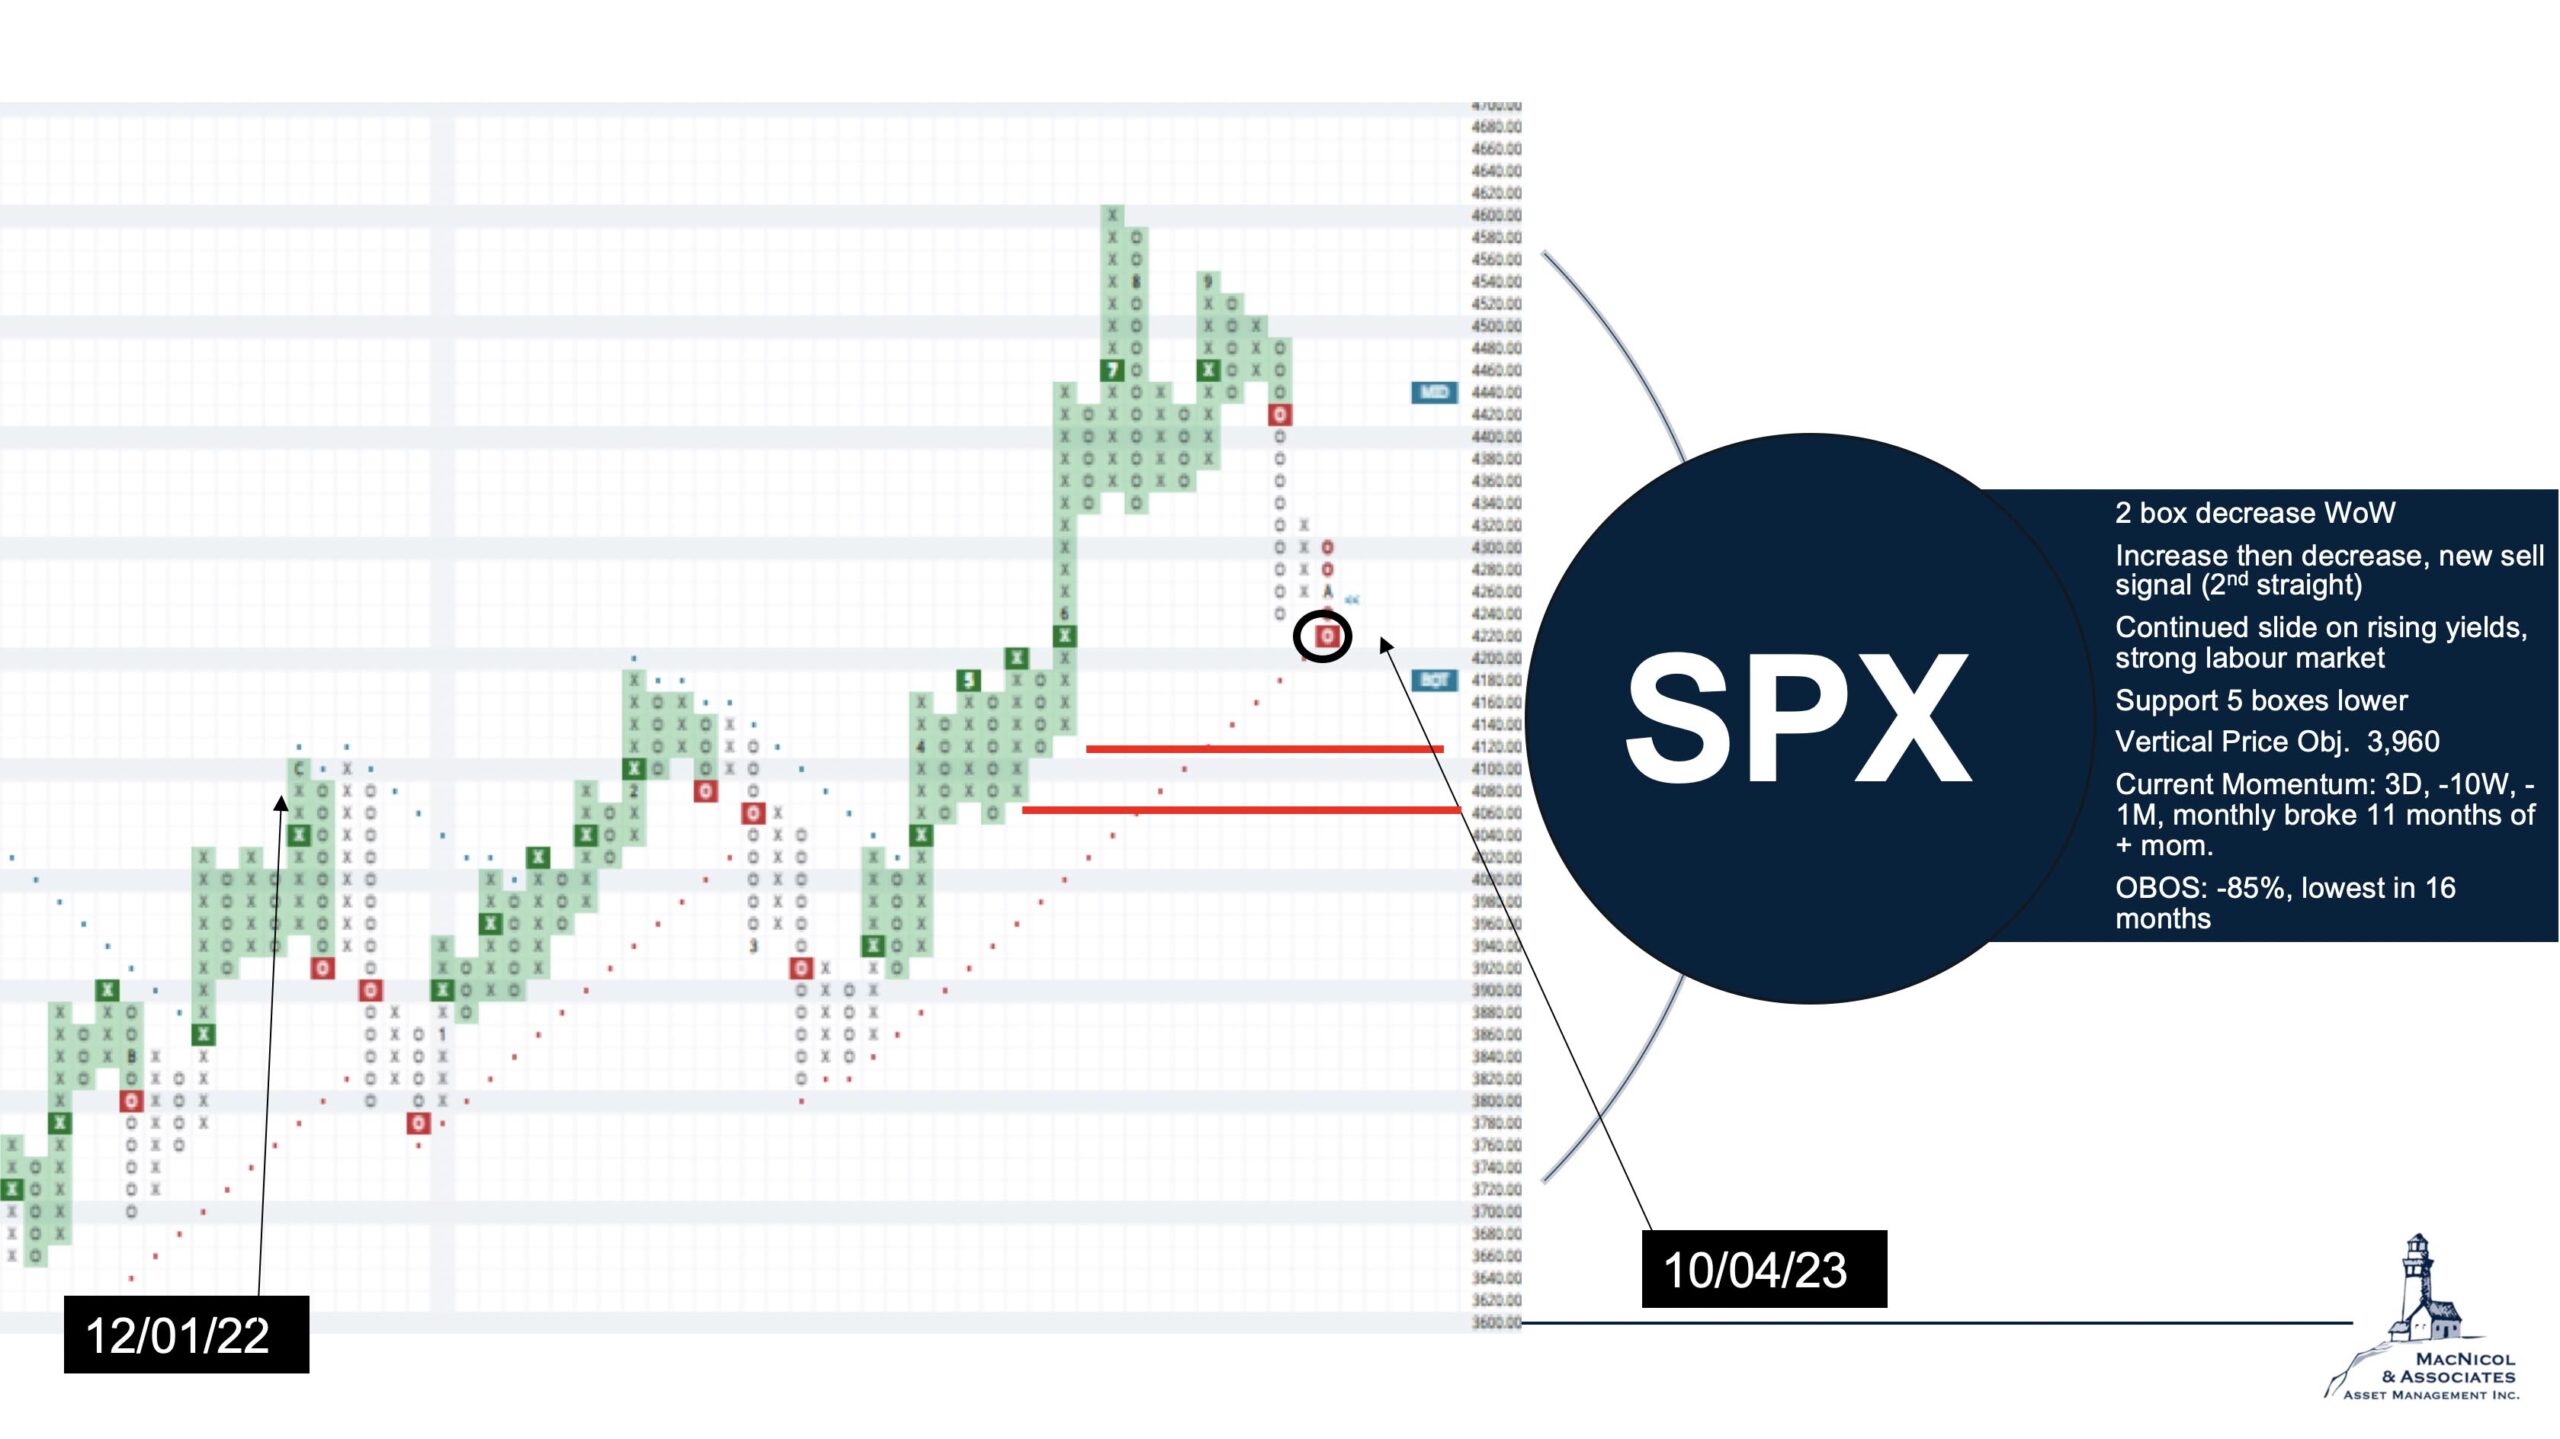
S&P and Market Signals
Shifting our gears to the S&P 500, we can see that we’ve moved off the highs, creating a sell signal. There’s a considerable number of selling in the major U.S. indices which leads to its oversold conditions. Moreover, the trends are approaching a critical point, with the S&P’s positive trend line teetering. The red dashed line, shown on the chart below, signifies a positive trend as long as the box remains above it. You’ll notice that the current position of S&P is right on that dashed line. This means the index is in a make-or-break area going forward.
Bullish Percentage Chart
The chart below tracks the percentage of companies exhibiting a bullish trend versus a bearish one. We’re only focusing on both the S&P on the left and the New York Stock Exchange on the right. Notably, both indices recently generated sell signals by the end of September to early October, a first since March.
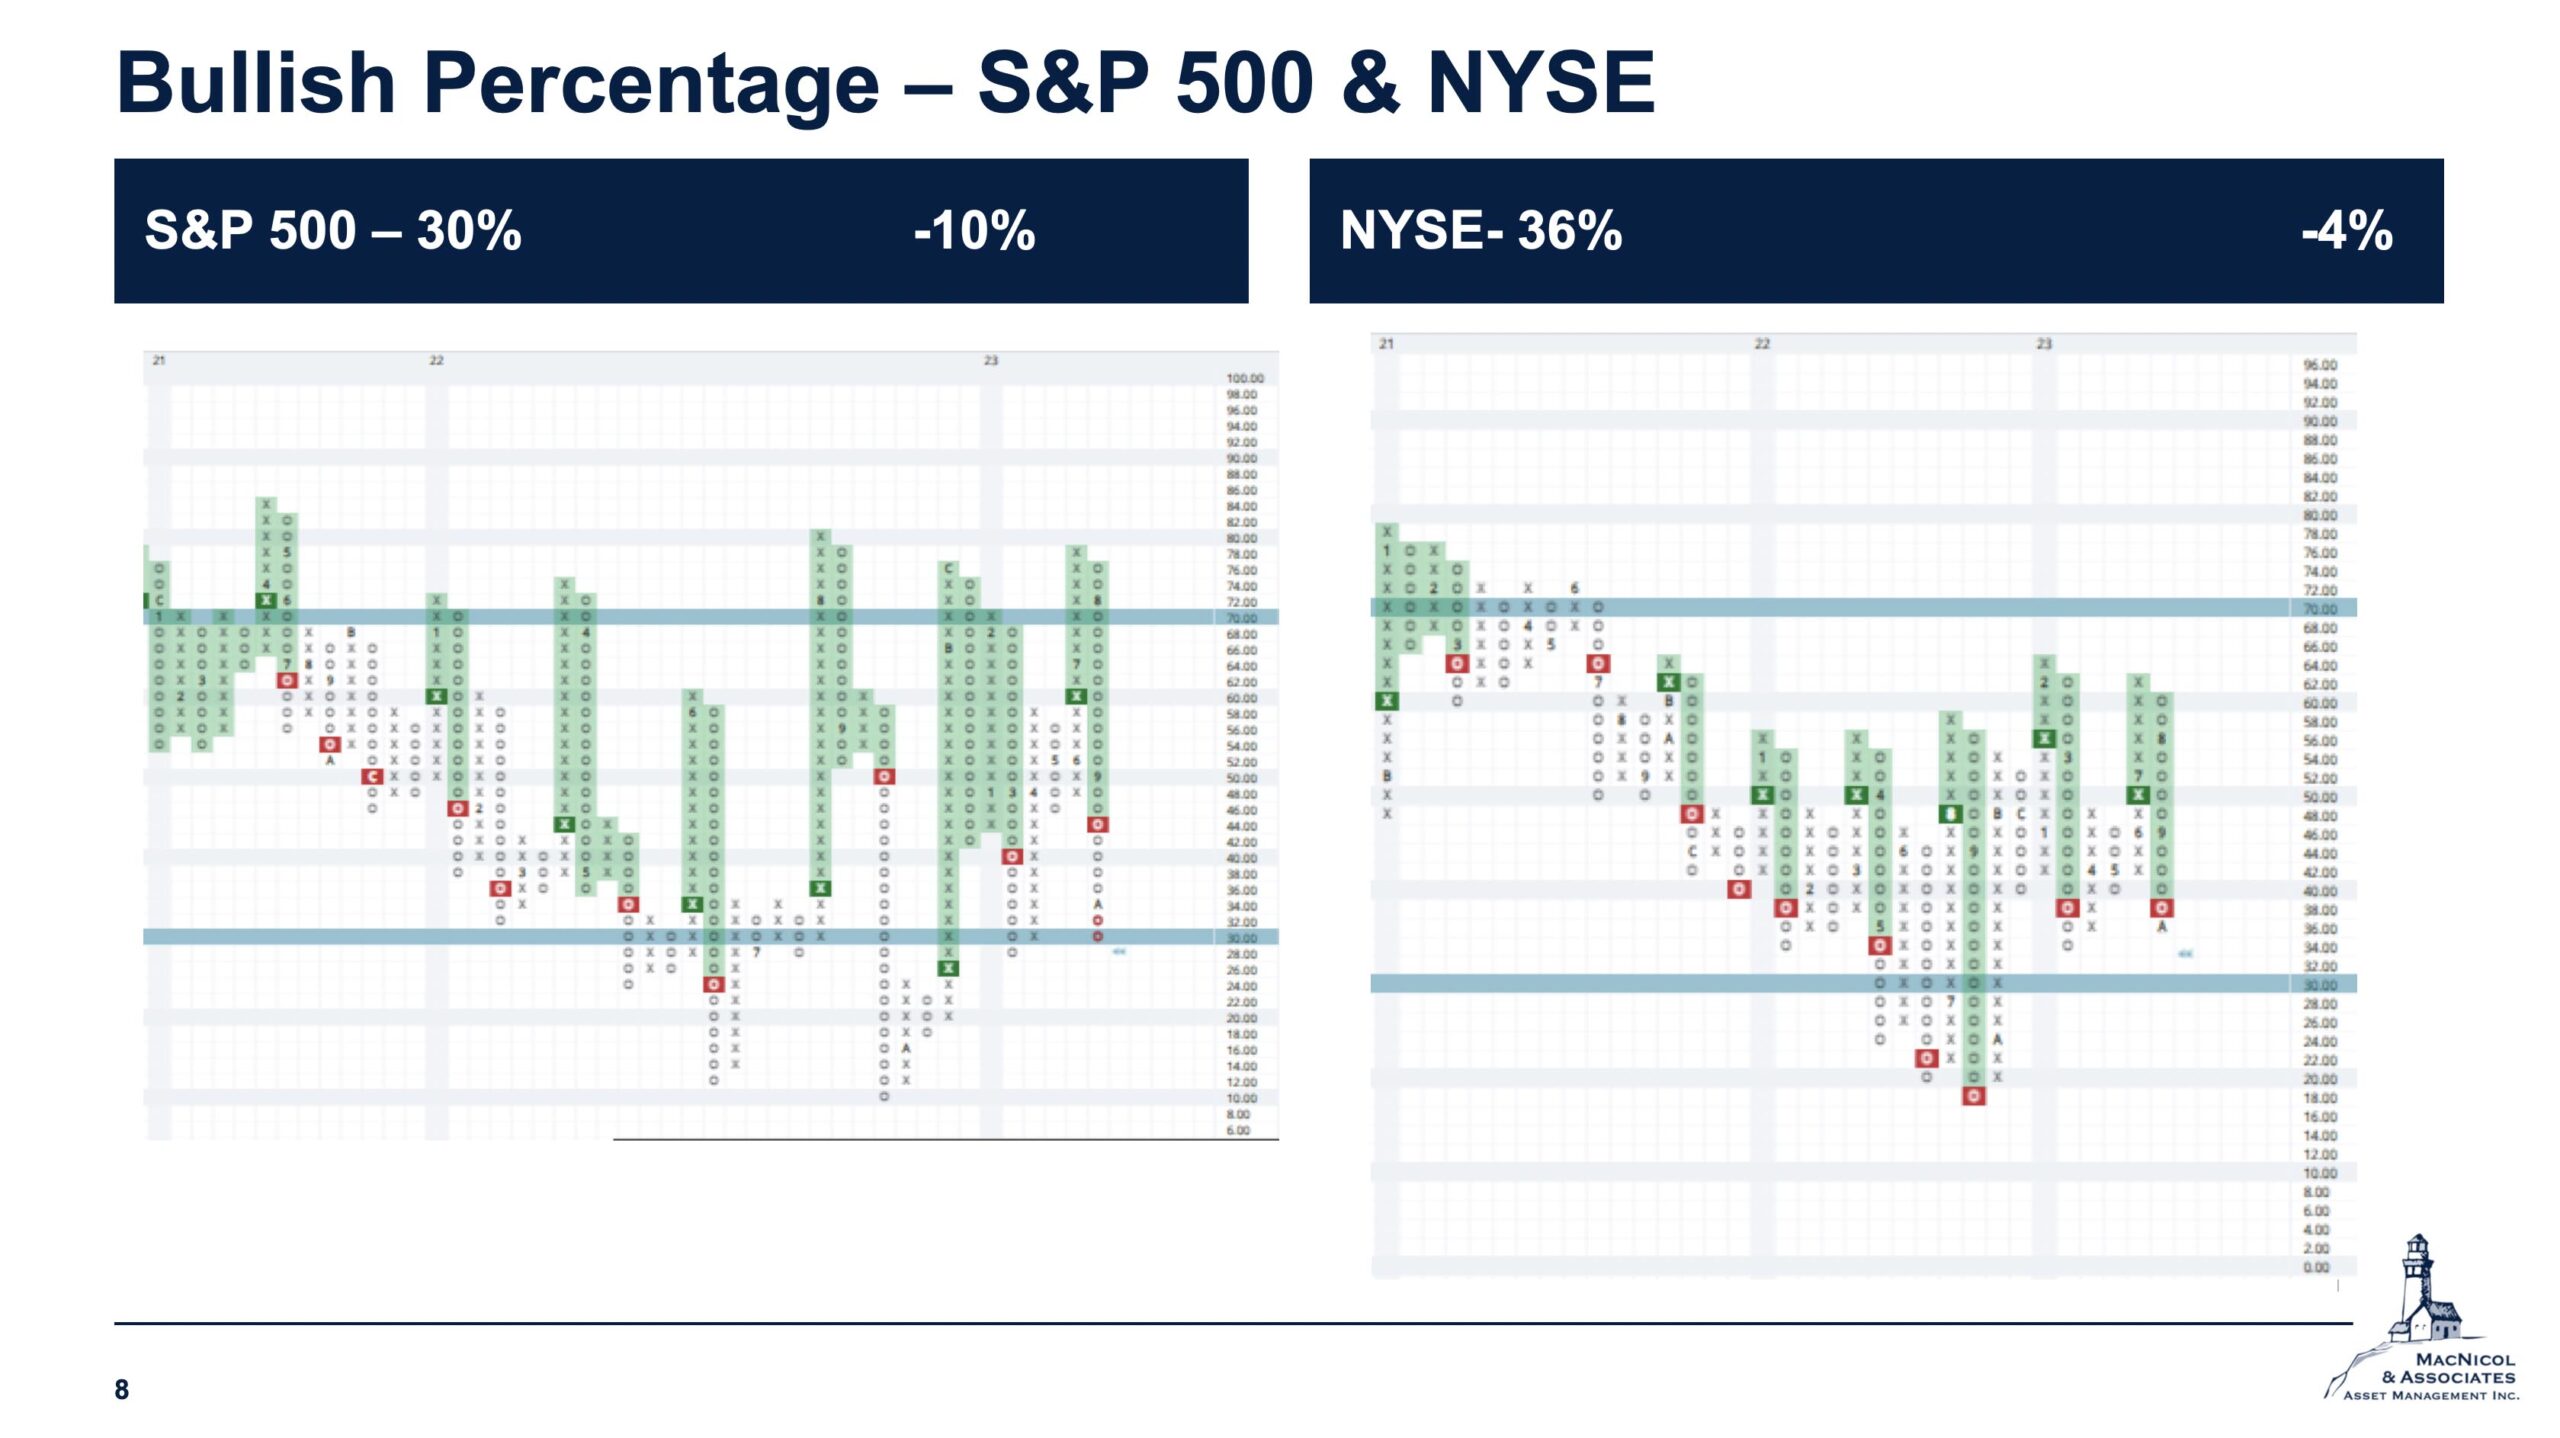
For the S&P, a drop below the bottom blue line signifies an official shift into bearish territory. Over the last few years, this bearish transition has occurred only twice, and both instances in 2022. The NYSE on the other hand remains more elevated, reflecting its composition of more defensive stocks relative to the S&P.
Nevertheless, we are closely monitoring these indicators as they provide early signals of market direction, and currently, we can see that they’re pointing towards a short-term shift in the wrong direction.
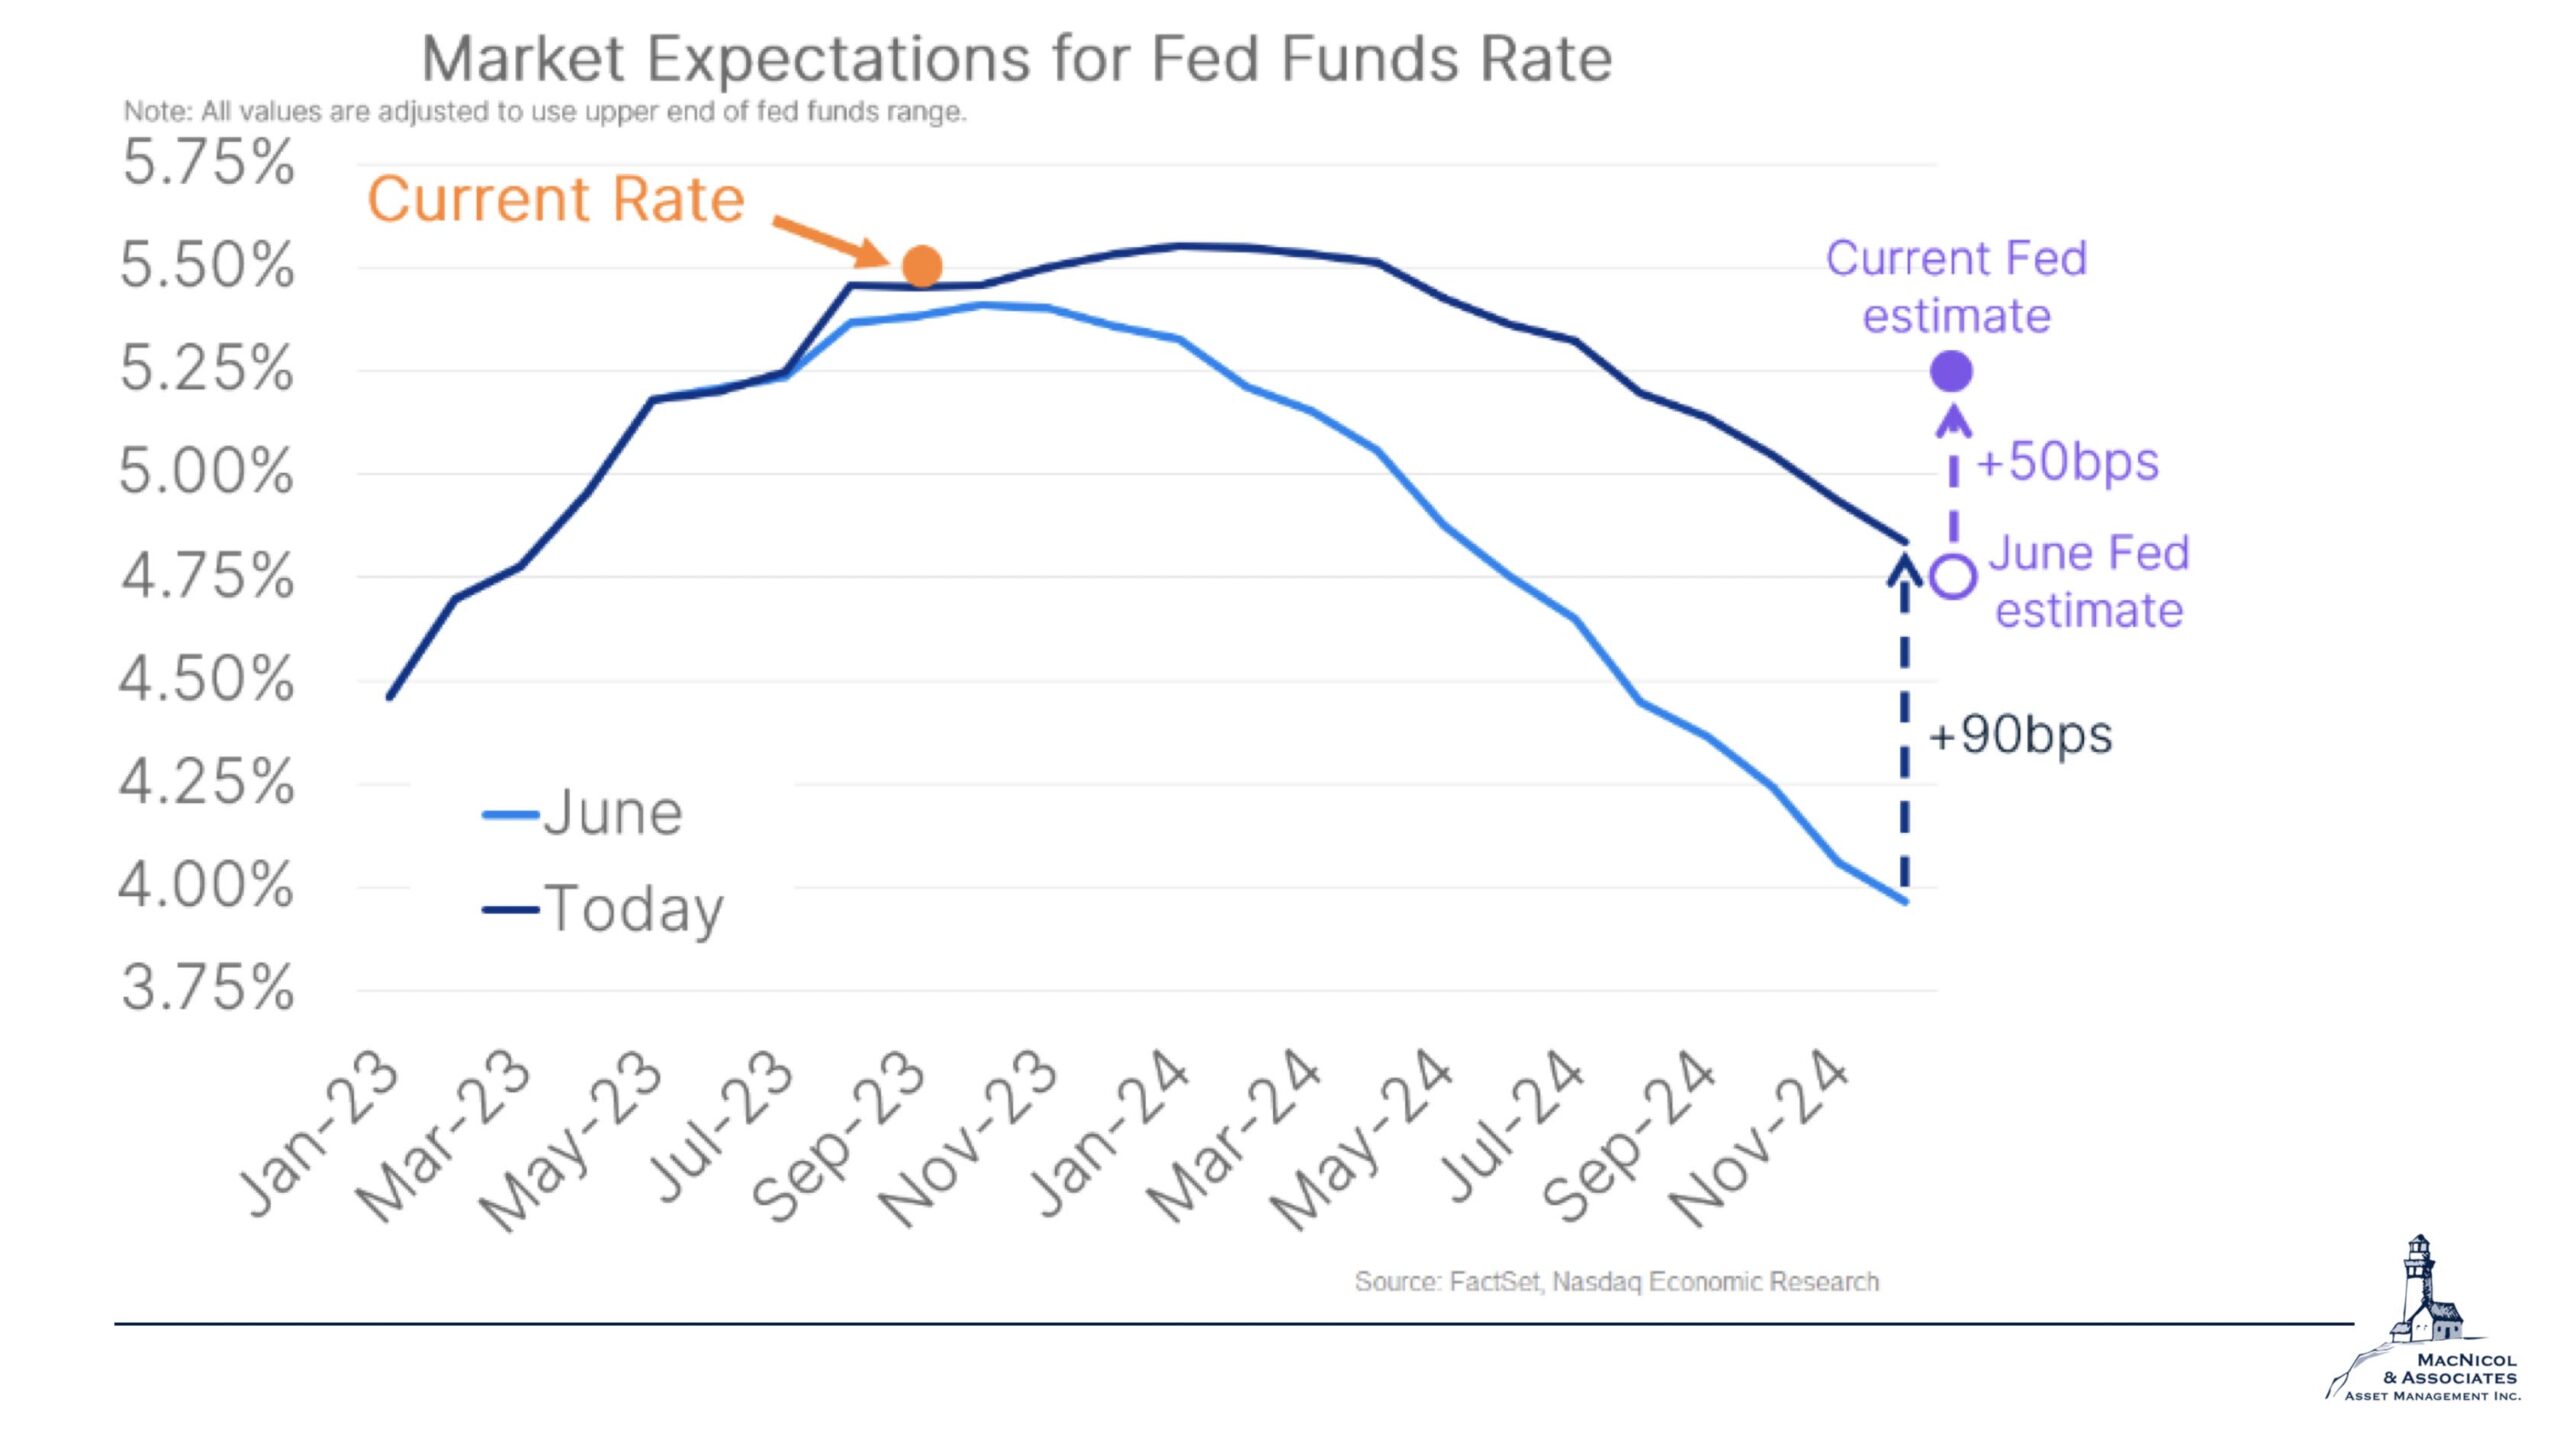
Market Expectations for the Fed Funds Rate
There’s a change in market expectations for the FED Funds Rate over the last four months. There has been a significant increase in the expected rate, signaling that the market anticipates elevated interest rates in the future.
Back in June, the market expectation for the FED Funds Rate was below 4% by December 2024. Now, we’re expecting a rate closer to 4.8%, a difference of 90 basis points. We will likely see elevated rates moving forward and we will continue to monitor these events as they happen.
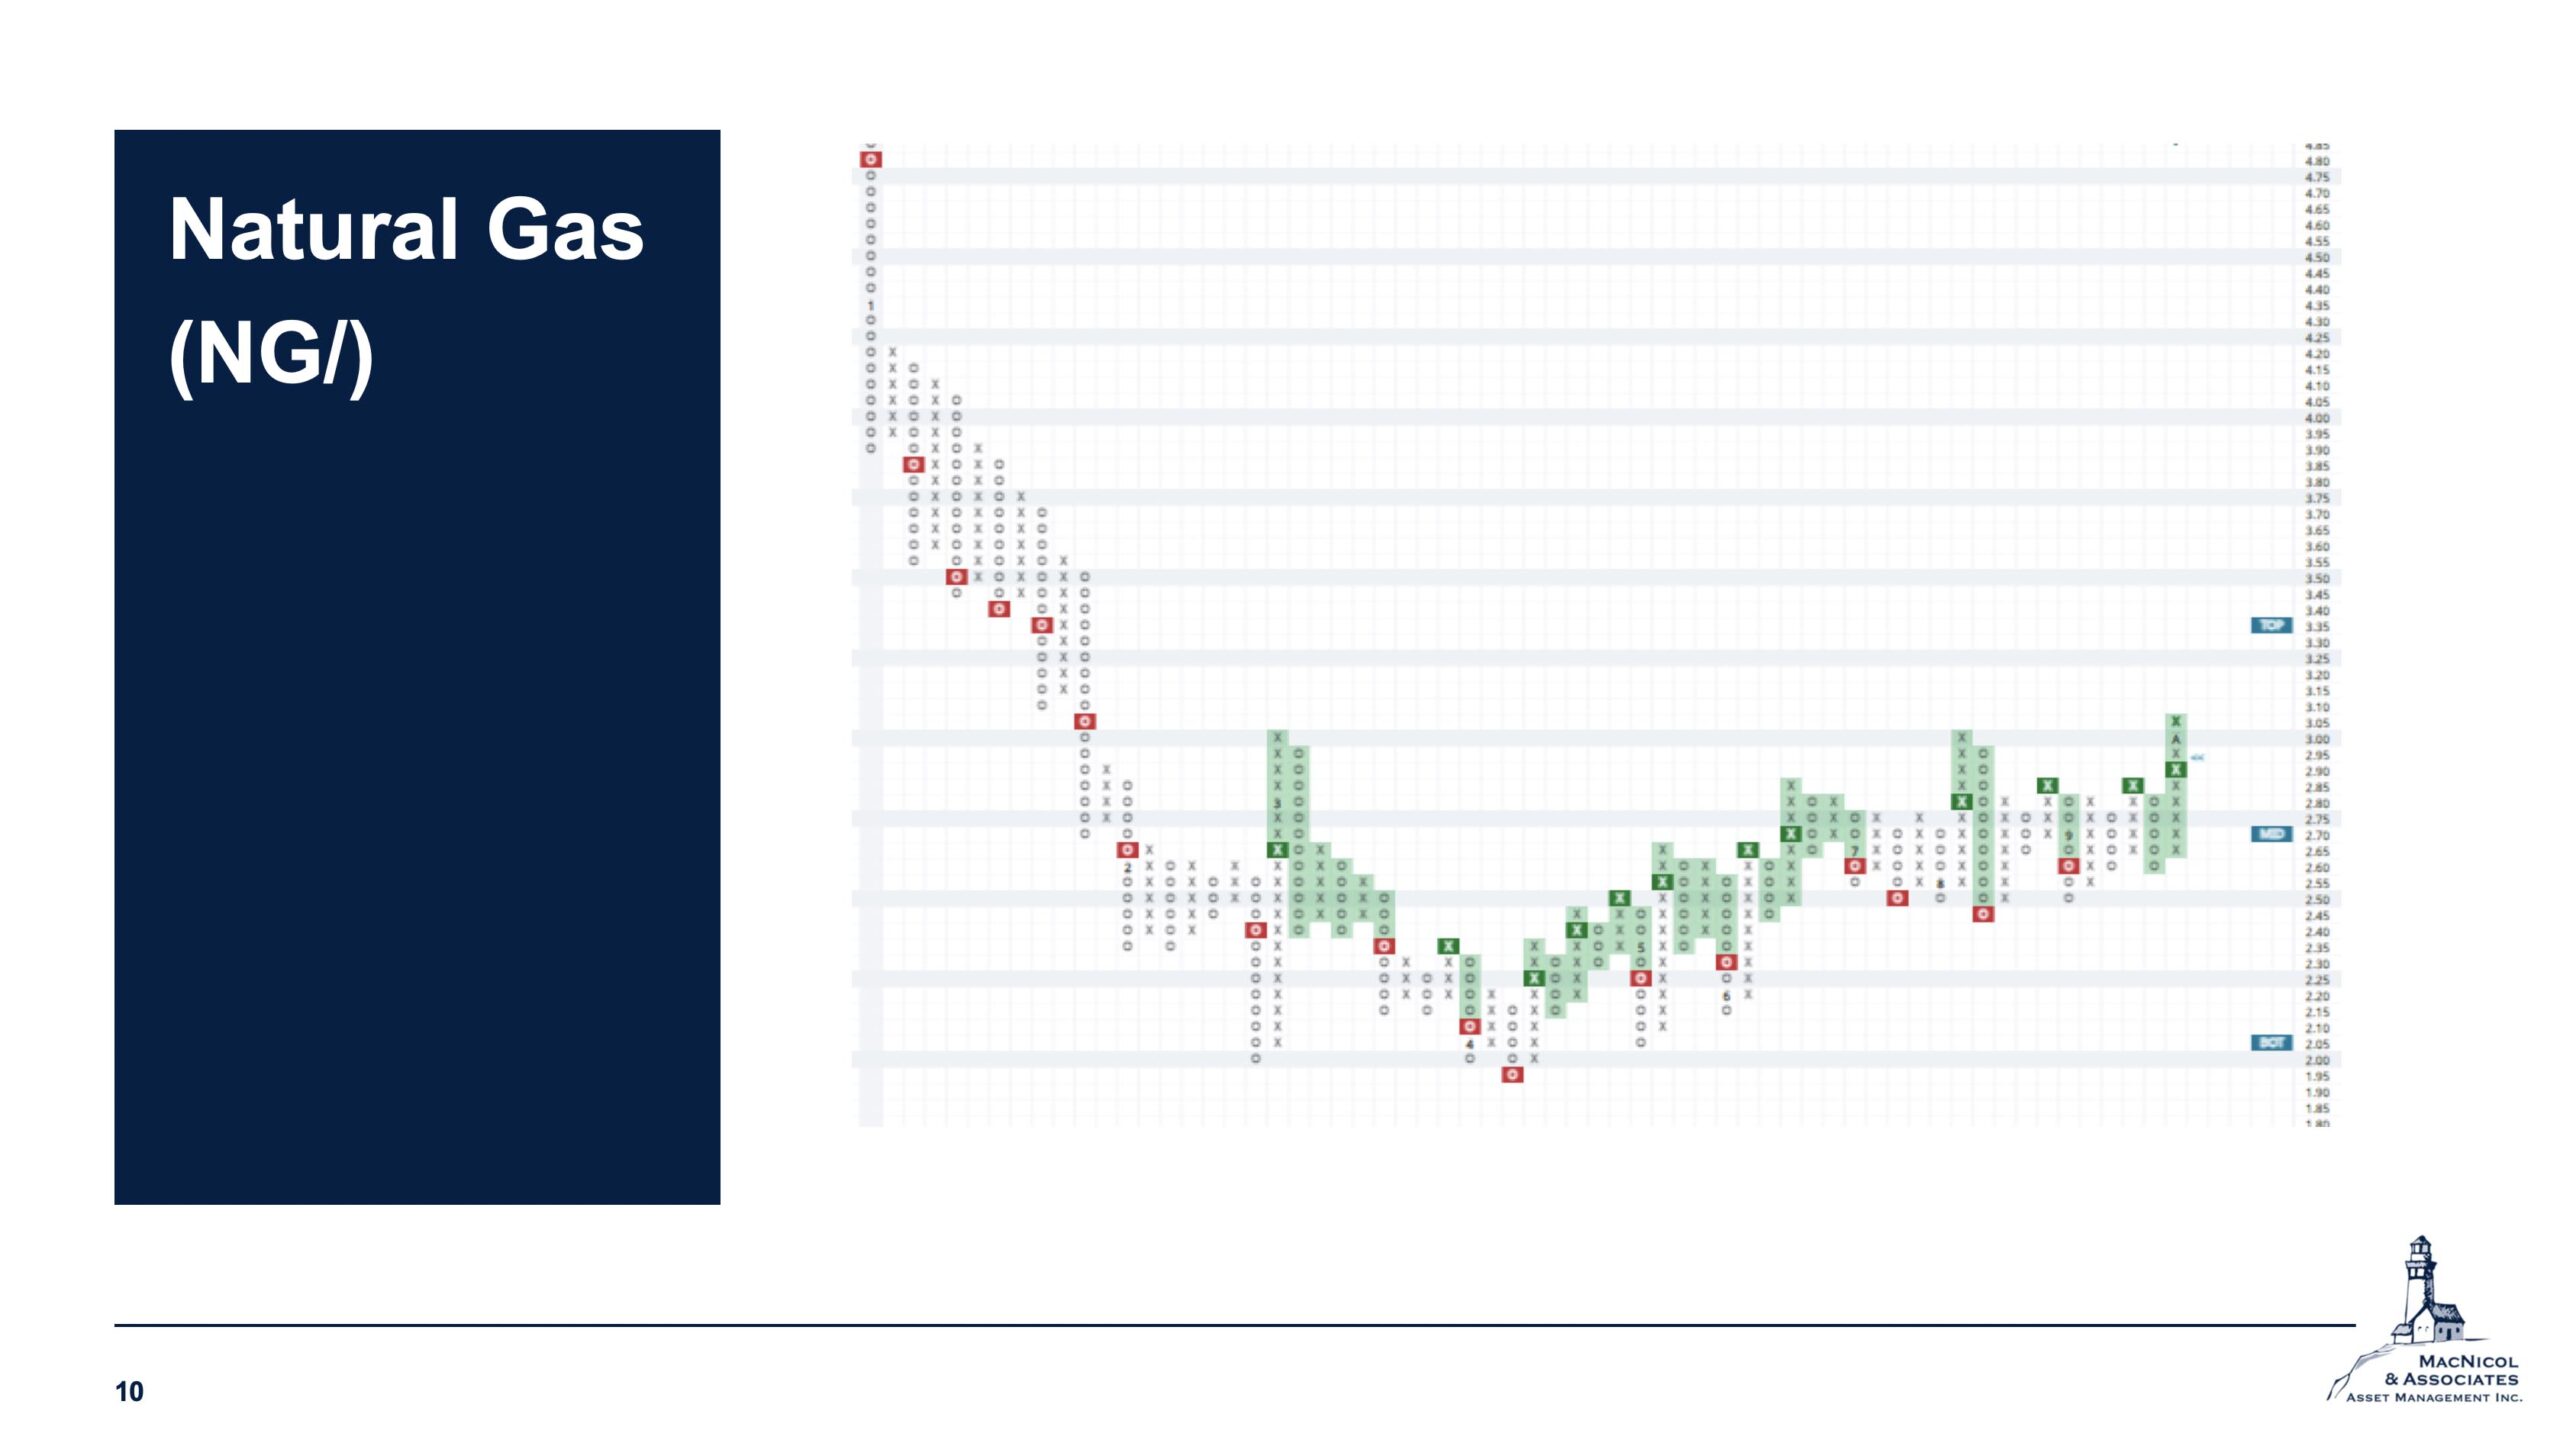
Natural Gas and Energy
Now, let’s look into the resurgence of crude oil prices (breaking the $3 mark for the first time since February) and its potential impact on natural gas.
As we approach the winter months, there’s a possibility of crude oil shortages and price spikes. Natural gas is also in an upside price target as a response to increased demand. These possible price increases might have potential implications for the broader market.
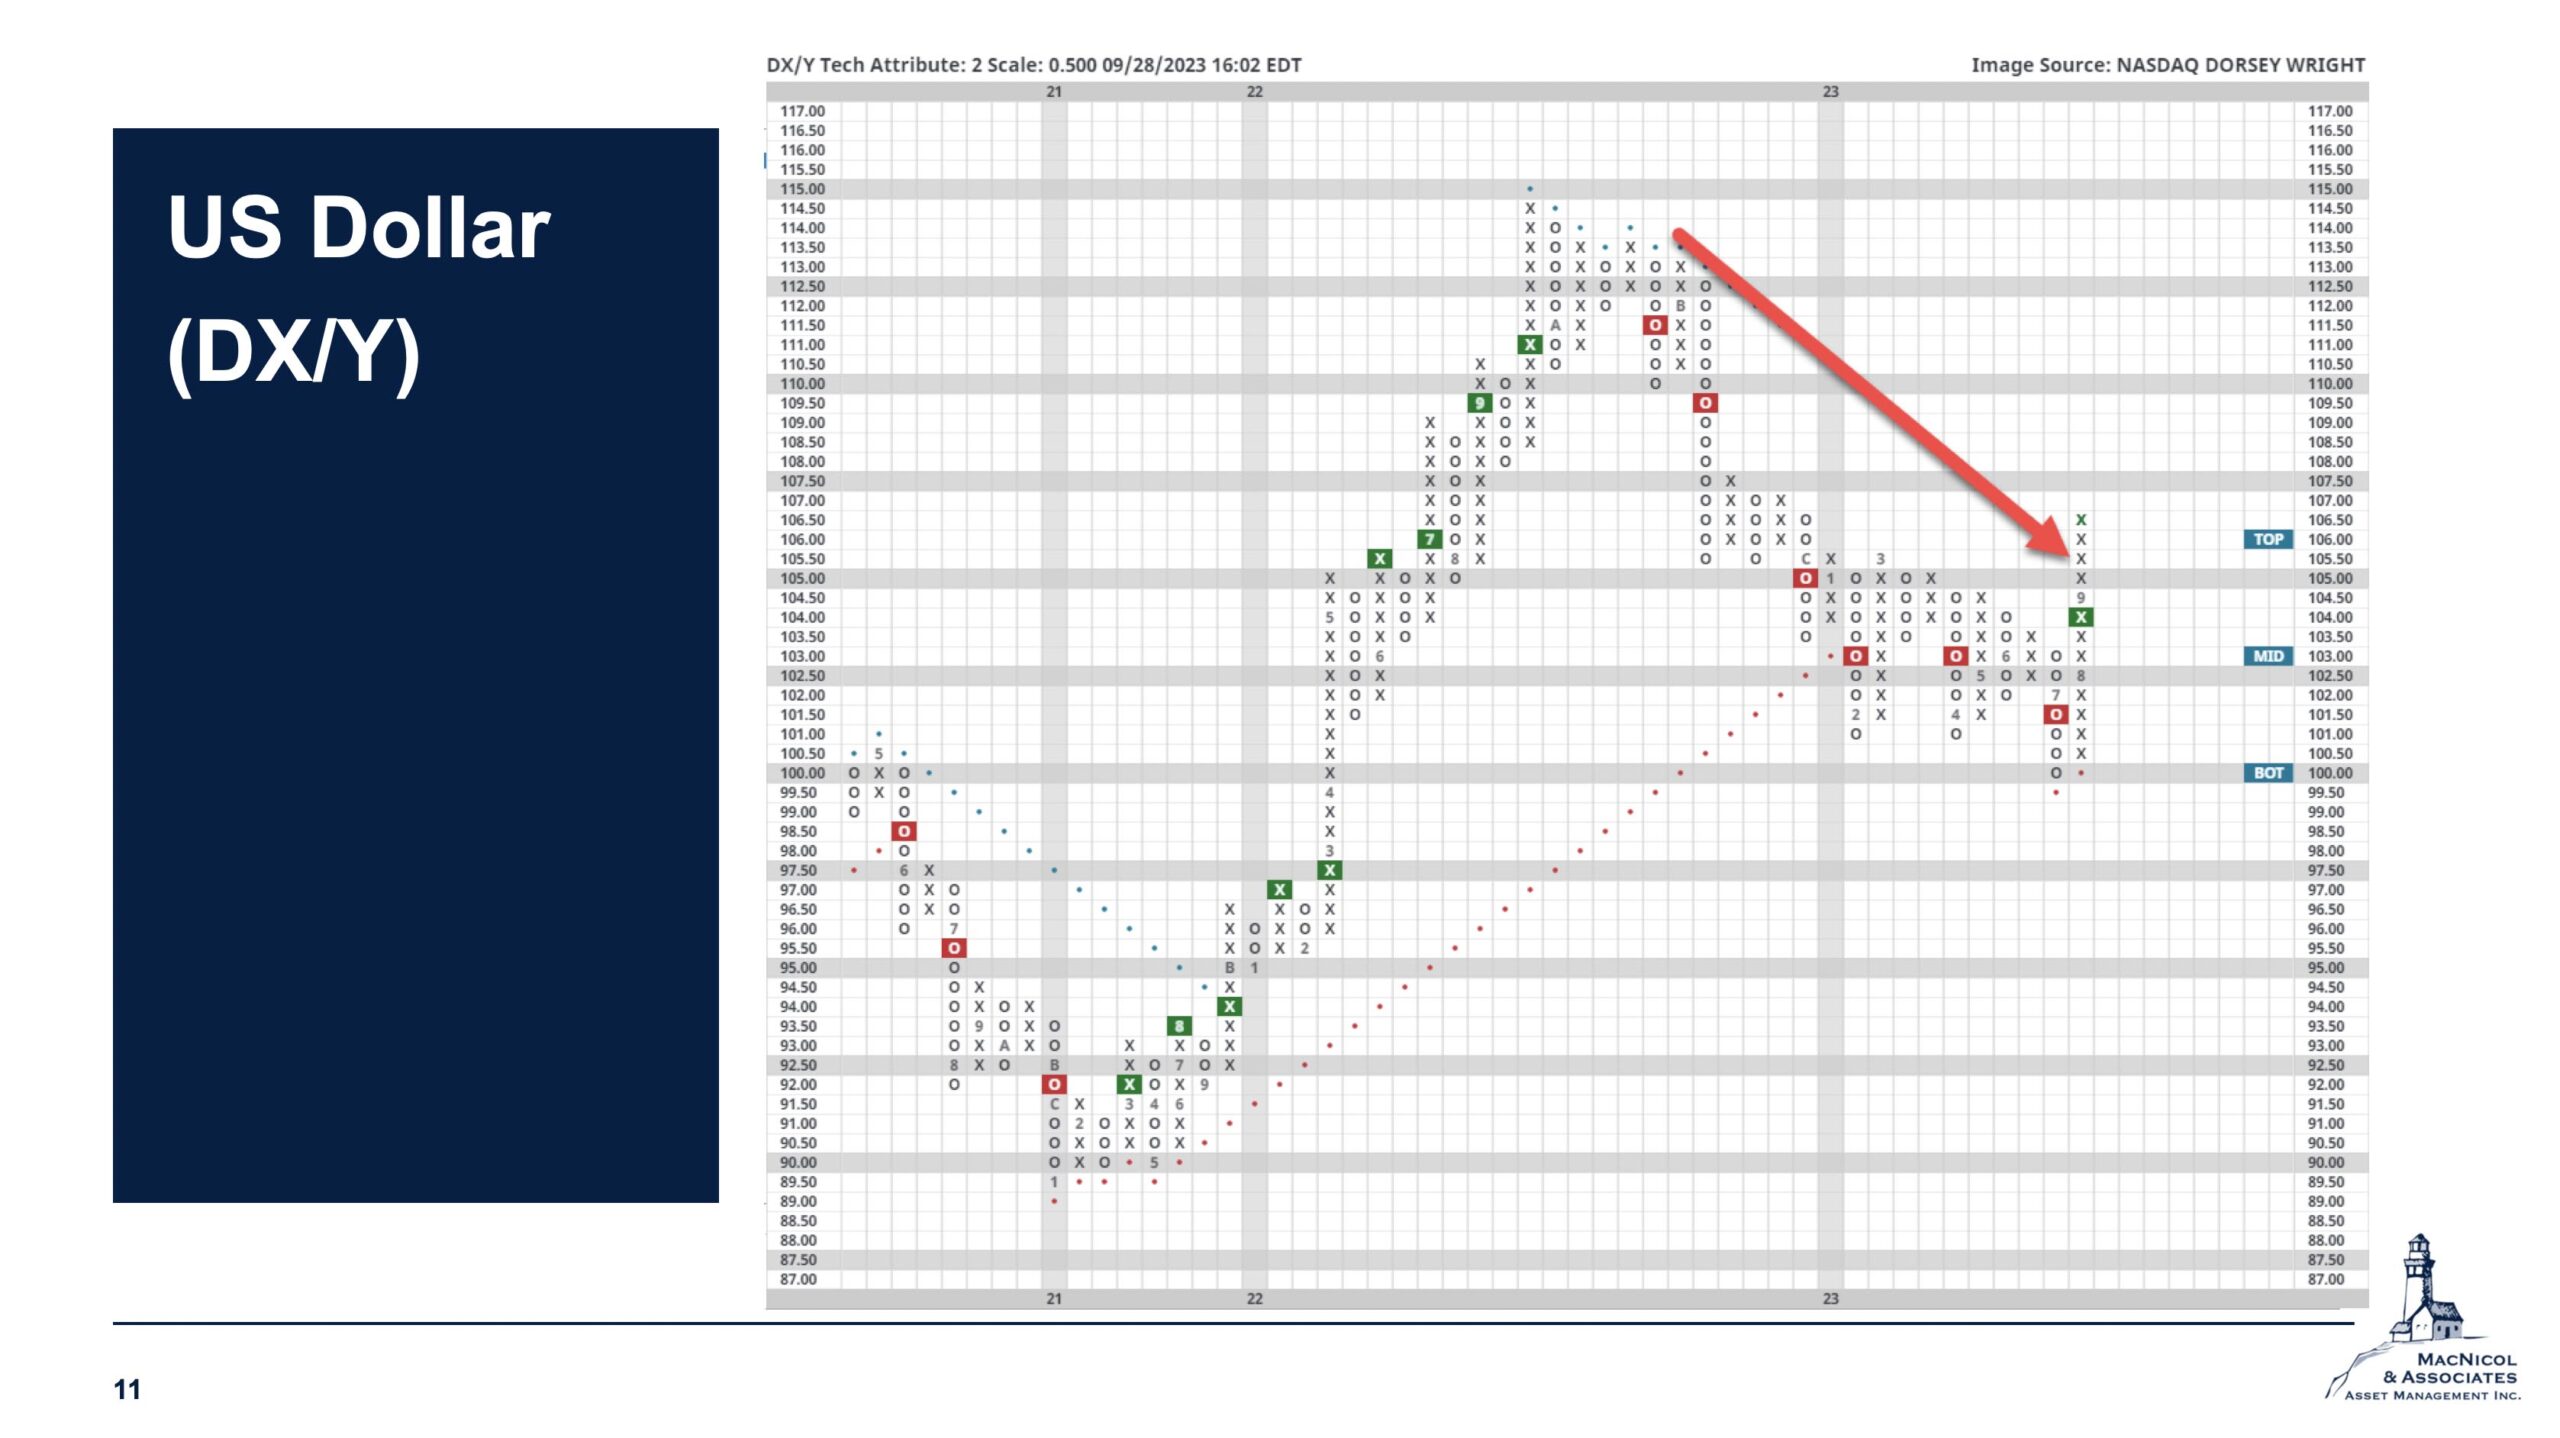
U.S. Dollar Strength
The U.S. dollar continues to strengthen relative to other developed currencies. This trend is driven by expectations of interest rate increases and rising long-term yields, which we’ve seen in the headlines in the past few weeks.
Alternative Asset Trust Fund Update: Contrarian Capital Management, LLC
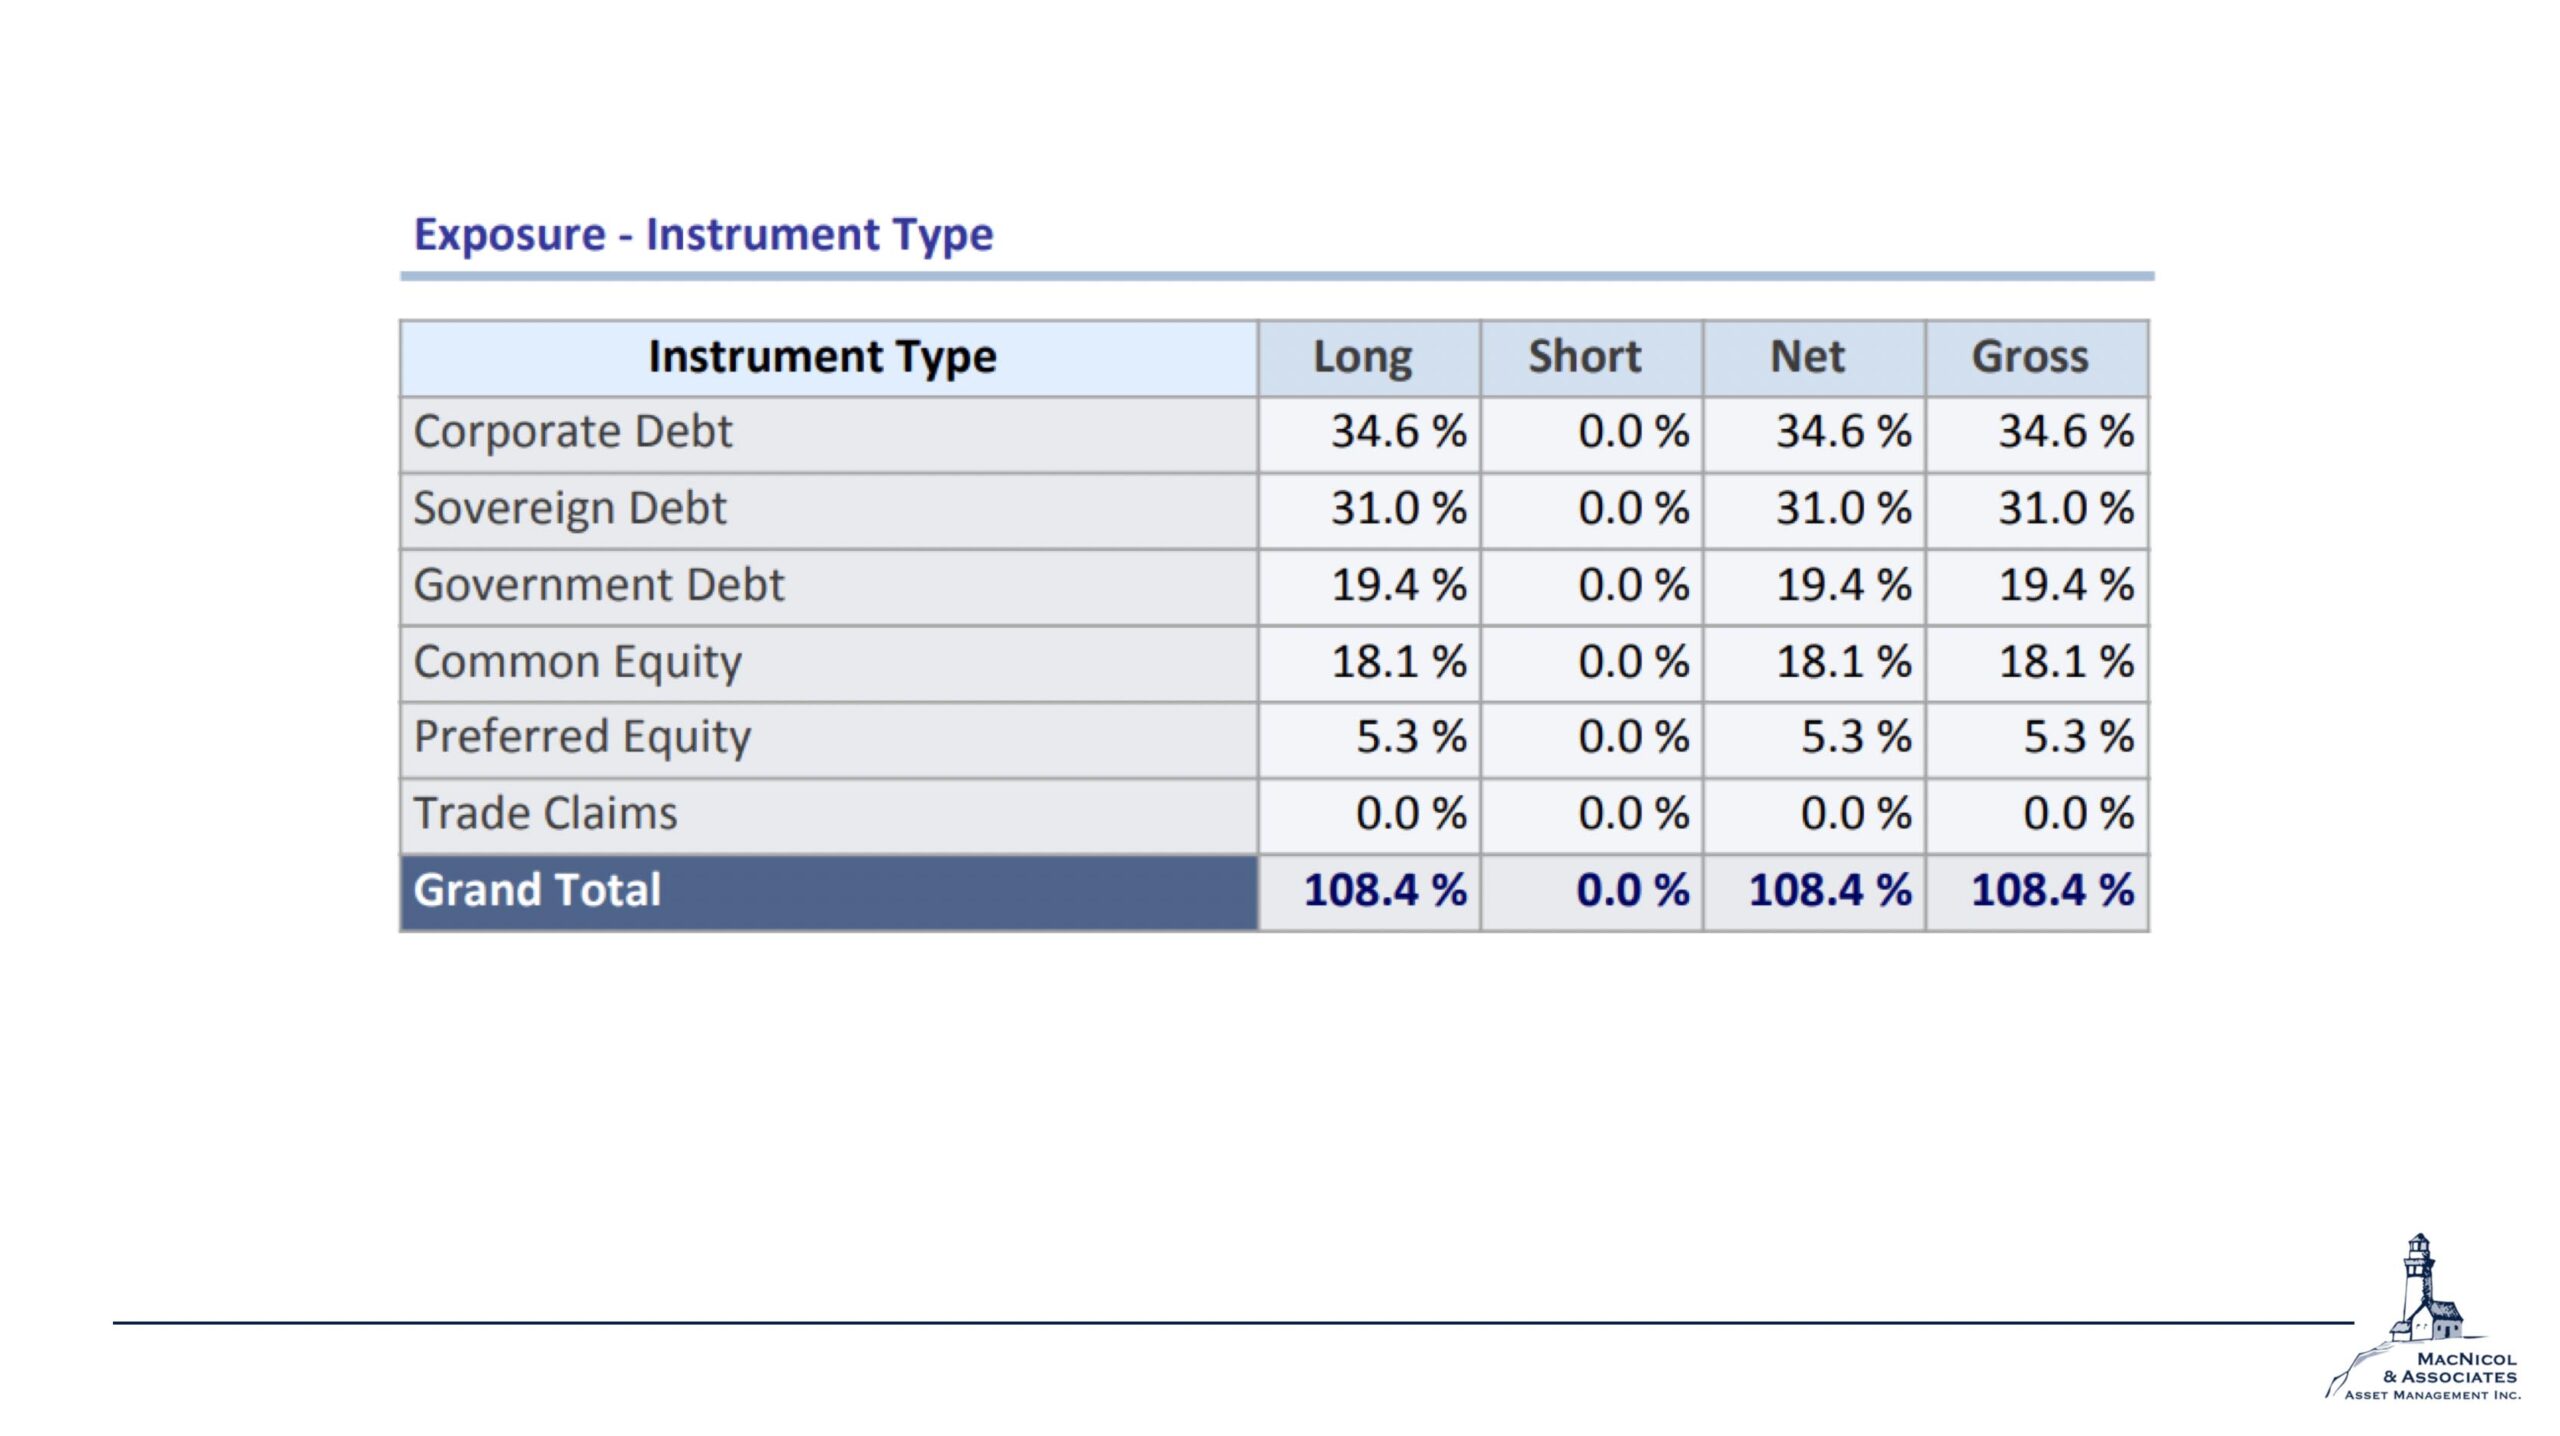
Lastly, a brief update on our Alternative Asset Trust Fund with a focus on one of our partners, Contrarian Capital Management, LLC. Contrarian’s investment strategy focuses on distressed debt in emerging markets. This strategy, which has delivered a 13% year-to-date return, involves purchasing bonds at discounted prices.
The chart below shows our net exposures to various types of instruments, corporates, and sovereigns. When you go into these areas –there are a lot of infrastructure, oil and gas, electrical utilities, and other prominent industries – you’re buying big positions. This is one of the investment strategies of Contrarian.
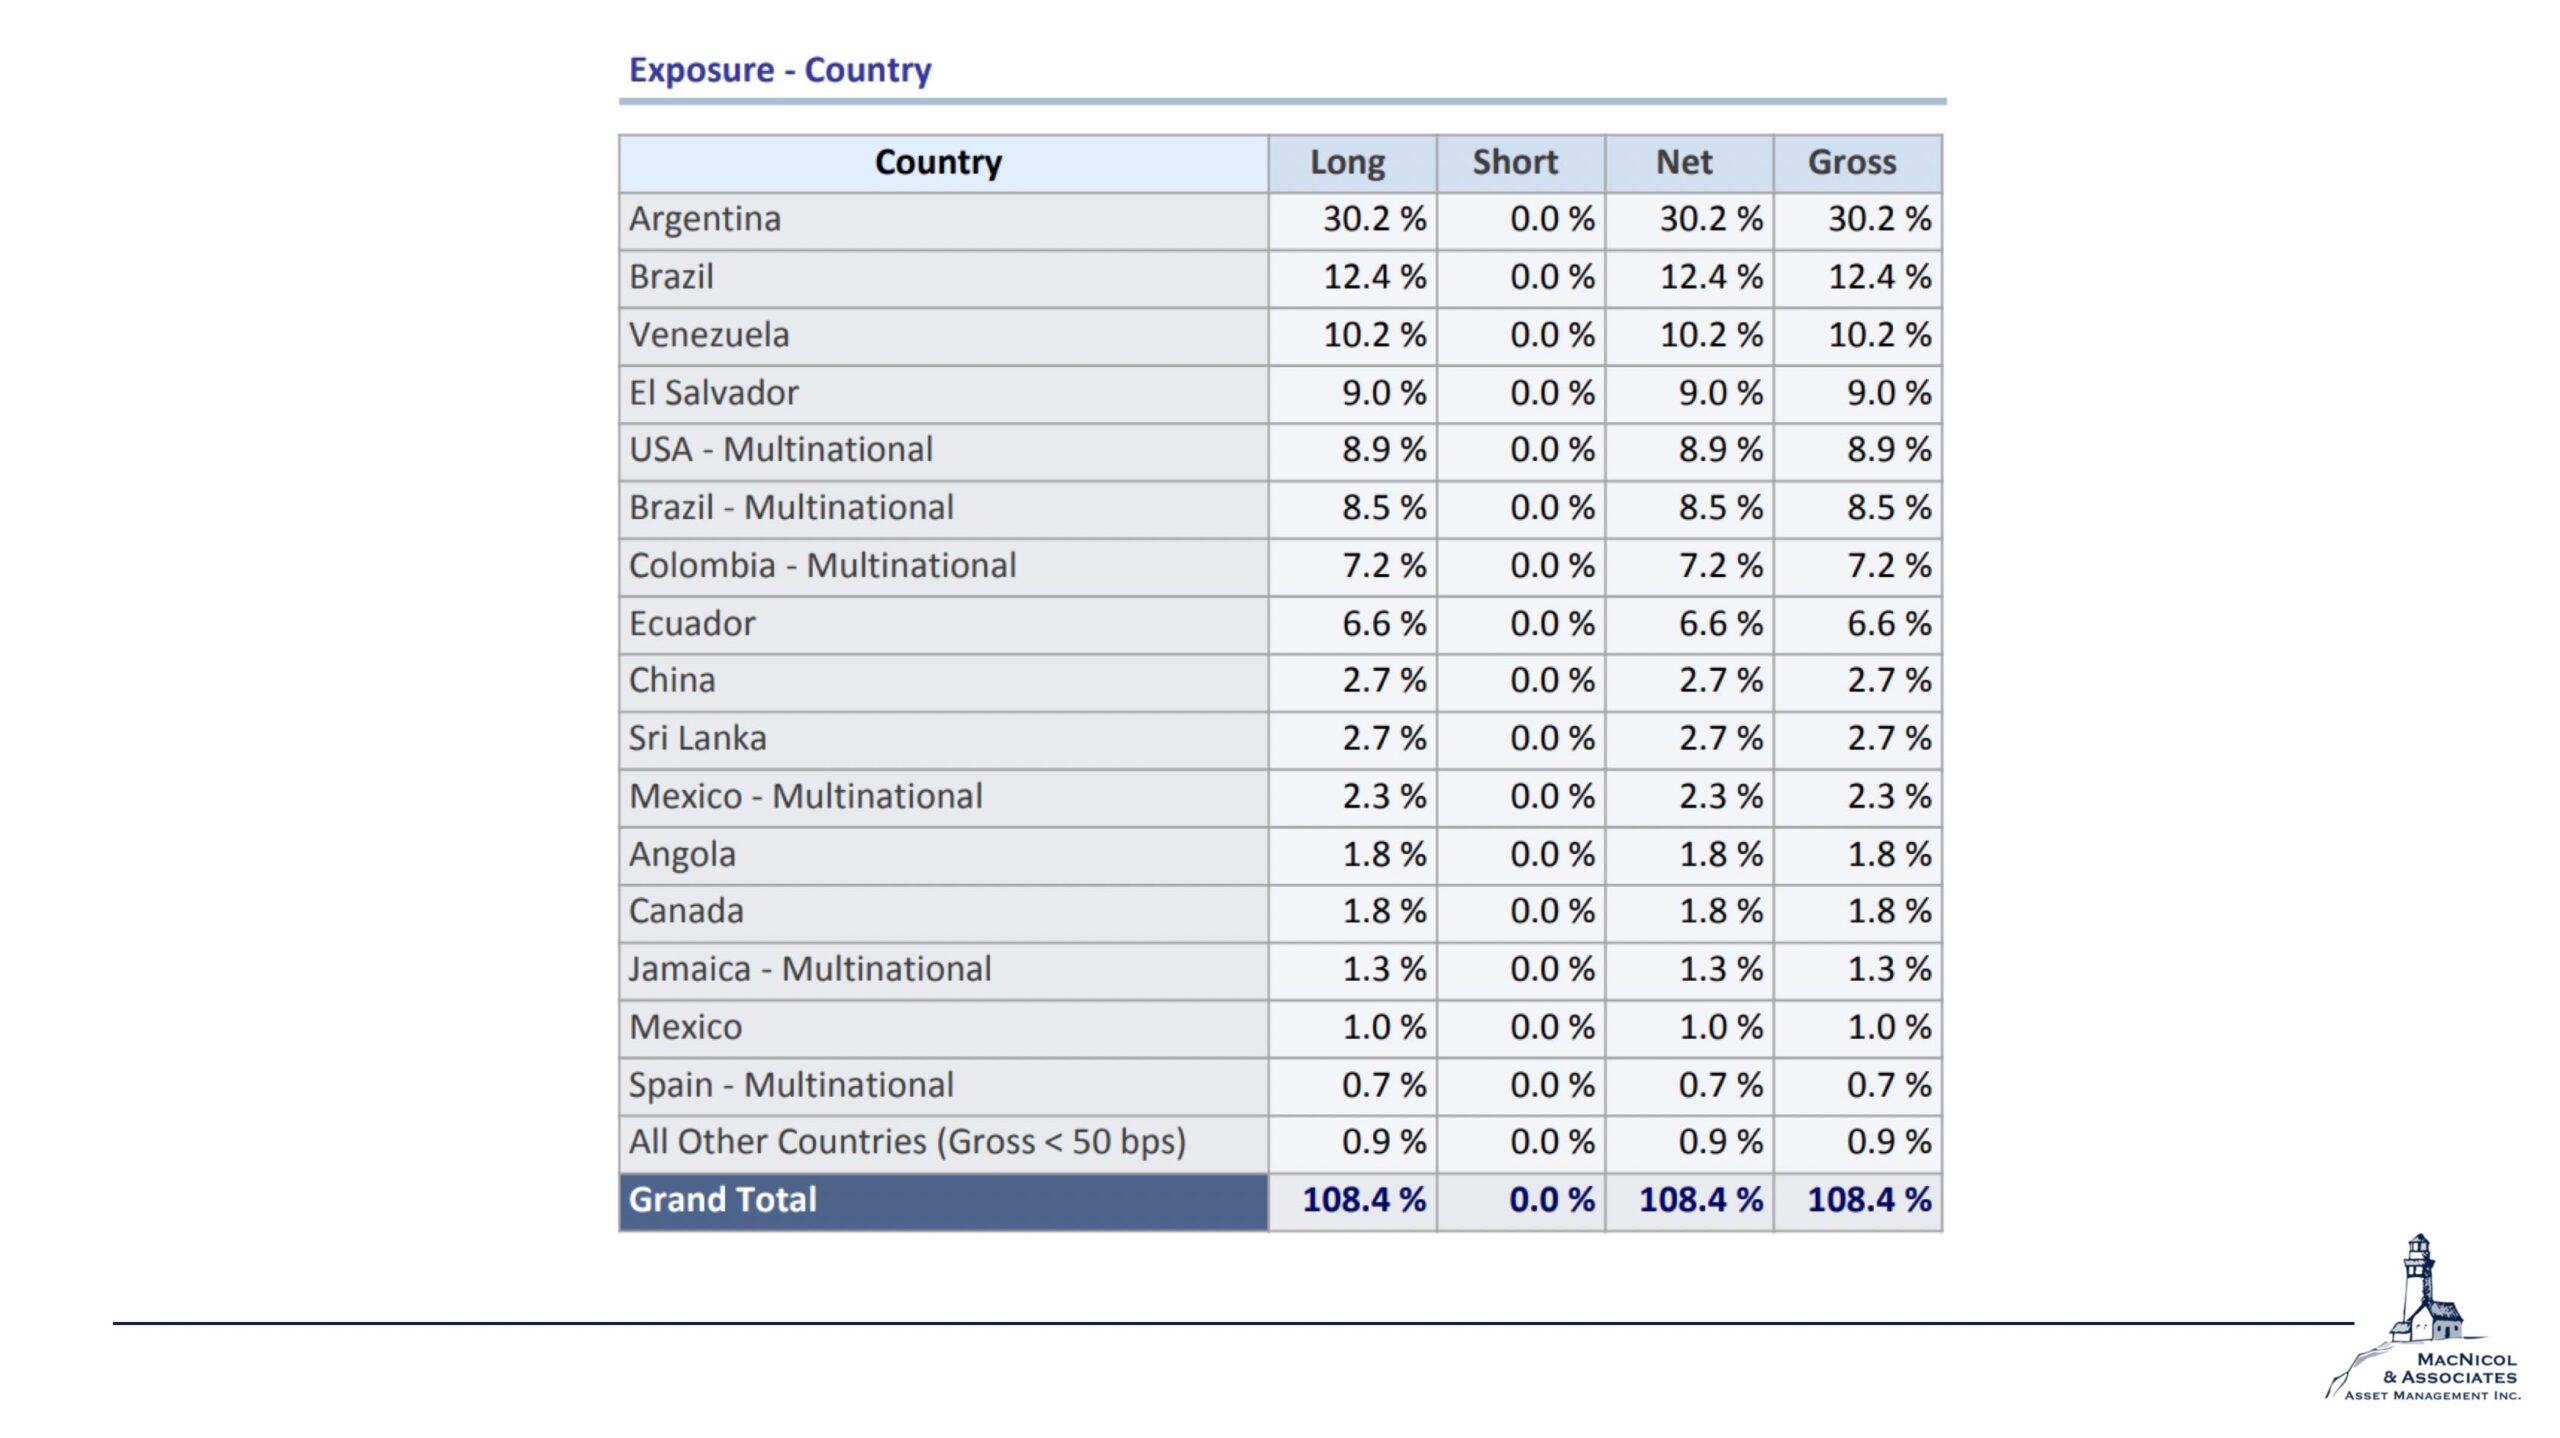
Contrarian’s approach to investing in emerging markets spans a range of countries. Among its countries of exposure, it’s notable that Brazil and Argentina take the lead in the portfolio. Brazil is known for boasting the largest bond market in the region and Argentina is also a significant player in the area, so we get the reason why they’re both at the top of the list. However, Contrarian’s investments extend even further, going into countries like Colombia, Ecuador, Mexico, and China.
Evergrande Bond Position
Touching on the Evergrande bond position, the fund holds senior secured debt with the company, which offers a more favorable collateralization in the event of financial distress. Can I move the map around the hedge fund? It can but it takes quite a shock to feel this change at the nav level. So, while there is a degree of volatility, portfolio diversification helps mitigate potential shocks.
MAAM team remains vigilant and proactive in navigating the financial landscape, ensuring the best possible outcomes for our clients.
We’ll reiterate what we say all the time with the updates and commentaries we provide: it’s essential for experienced financial advisors and investors to stay informed about these market trends, but these articles are meant for information, not advisory. Contact our team to discuss investment management and strategies.
Thank you for joining us for this month’s market update, and we look forward to sharing more valuable insights in the future. You may also watch the Monthly Market Update video here.