

What a wild year! We can’t believe we’re closing 2023 in the next few weeks. Despite how the markets have performed this year, we hope that our regular commentaries have given you insights and helped you make informed investment decisions.
Before we kick things off for this month’s market update, a quick reminder: what you’ll read here isn’t investment or tax advice. For that, turn to the experts. Read the full disclosure here.
Now, onto the meat of the matter.
Venterra Realty Fund Update
Venterra Realty specializes in the comprehensive life cycle of multi-family residential communities in southern United States. From identifying opportunities and securing financing to development, acquisition, and meticulous management, Venterra is dedicated to creating and maintaining thriving living spaces.
Headed by John Foresi, the MacNicol & Associates Alternative Asset Trust Fund has invested in Venterra, and we couldn’t be more pleased with this partnership.
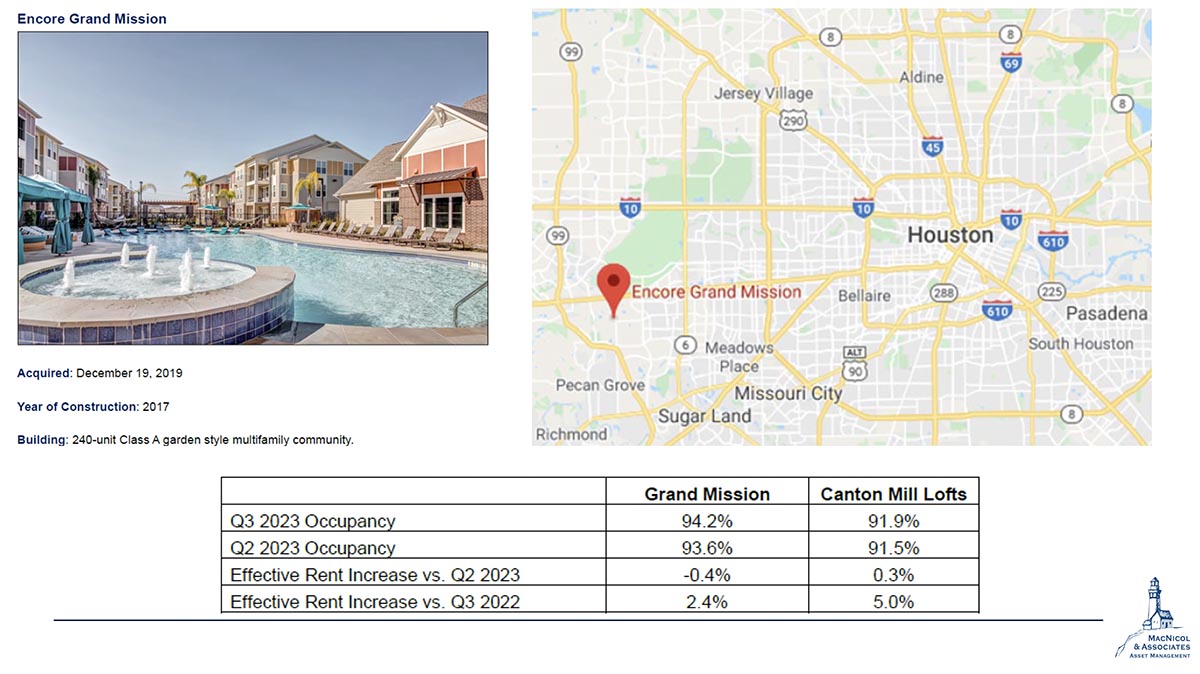
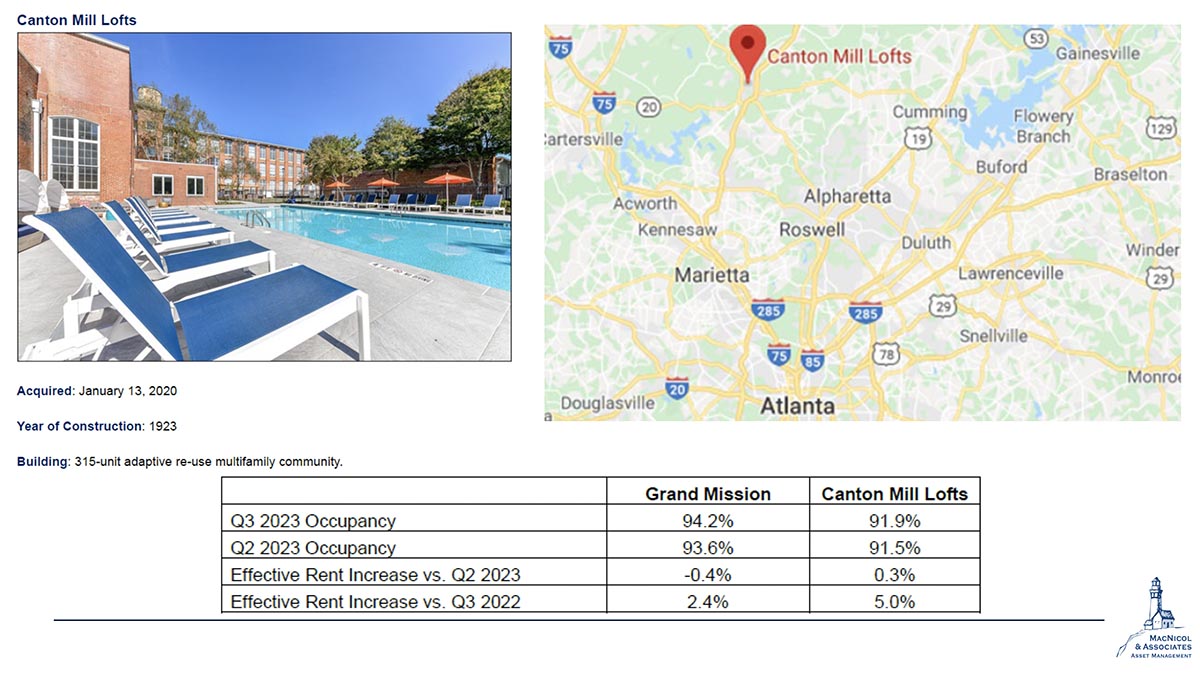
One of the things we always look at in a portfolio is the performance of the assets relative to the last quarter, and the occupancy of both the Grand Mission and Canton Mill Lofts is pretty solid. They have over 90% occupancy rate which is what we call in commercial real estate as “stabilized.” This makes them eligible for agency-backed financing, which will, essentially, bring the cost of debt down.
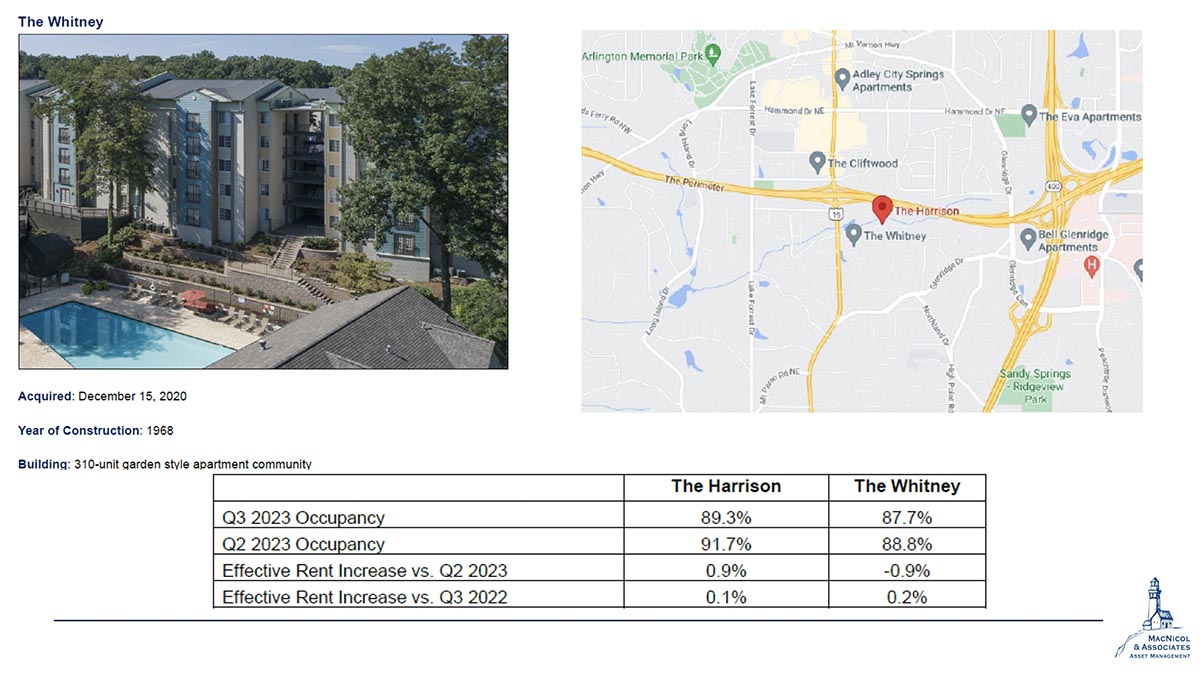
On the other hand, The Whitney, a310-unit apartment in Greater Atlanta city, shows a bit of slippage compared to Q2 2023, but the rent roll is holding strong. Atlanta’s real estate scene continues to impress.
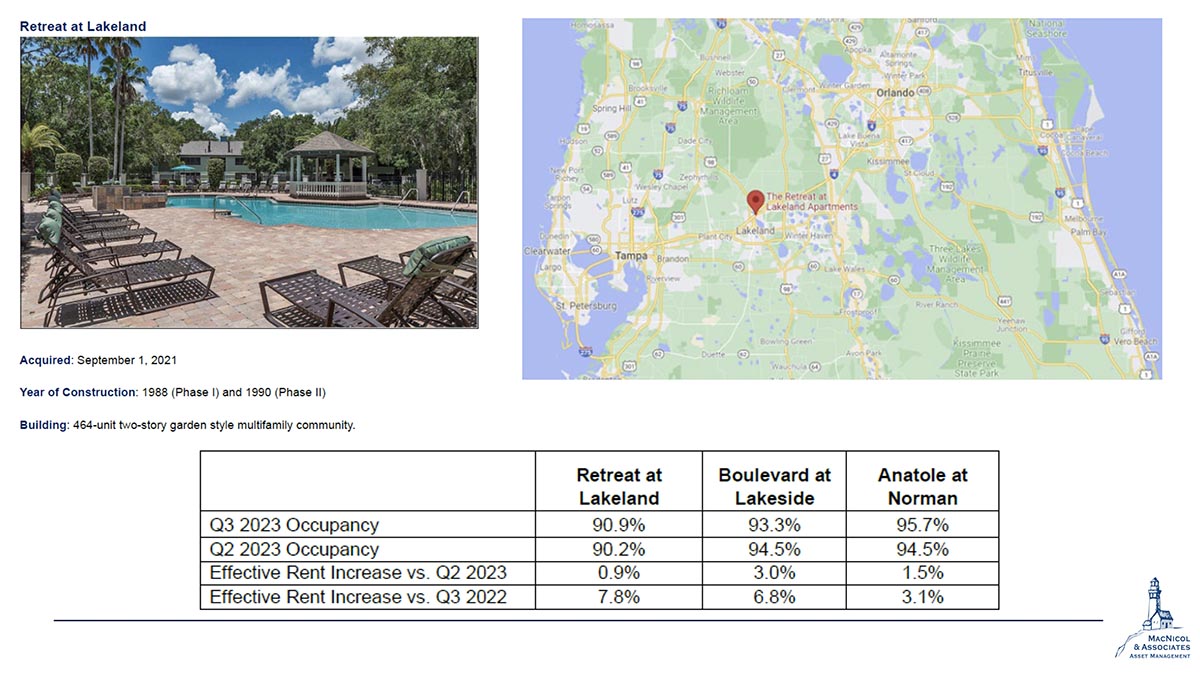
Another impressive asset in the portfolio is Retreat at Lakeland. This 2021 addition is a 464-unit two-story garden-style multifamily community. It’s close to full occupancy along with Boulevard at Lakeside and Anatole at Norman.
So, even in the face of rental increases and interest rate concerns, with properties of this caliber, it does help with the cause.
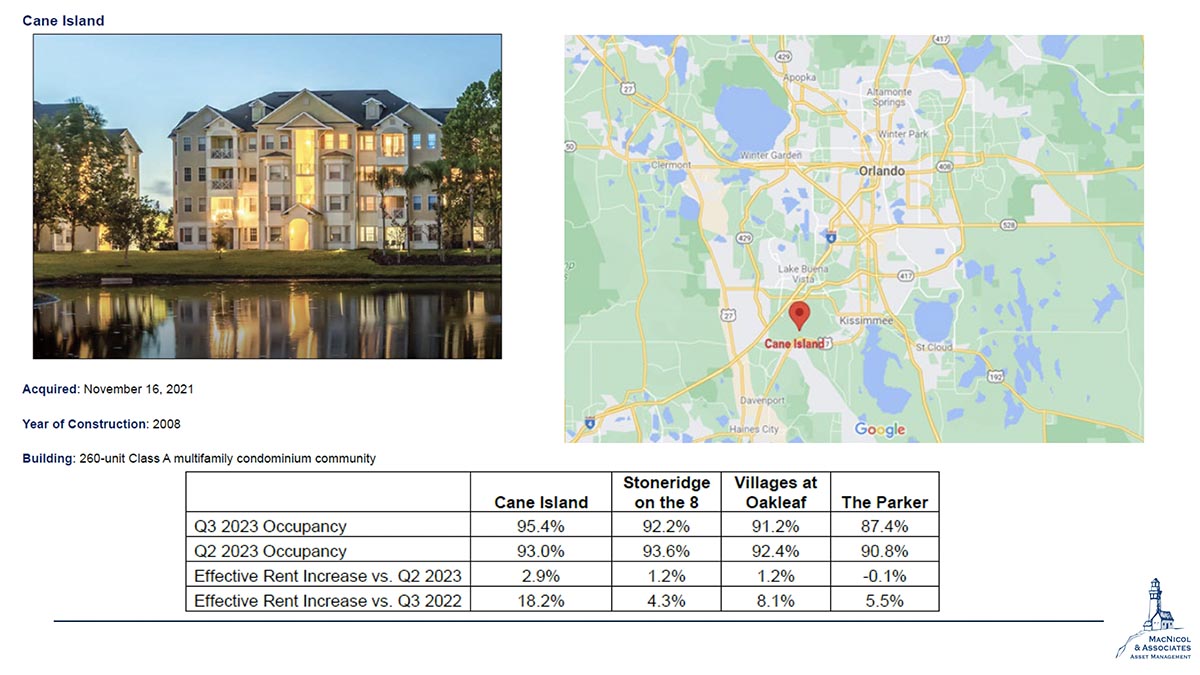
Cane Island is another portfolio that continues to impress, together with Stoneridge on the 8, Villages at Oakleaf, and The Parker. 90+% occupancy there too, aside from The Parker with 87.4% but looking into the weighted average, we still have something around the 90% mark, which is an excellent occupancy rate compared to industry benchmarks.
A lot of these assets, because of their stability and their relative reliability, perform better than others. This is one of the reasons why we are keen on partnering with Venterra, their real estate developments are not only top-rate but also perform great.
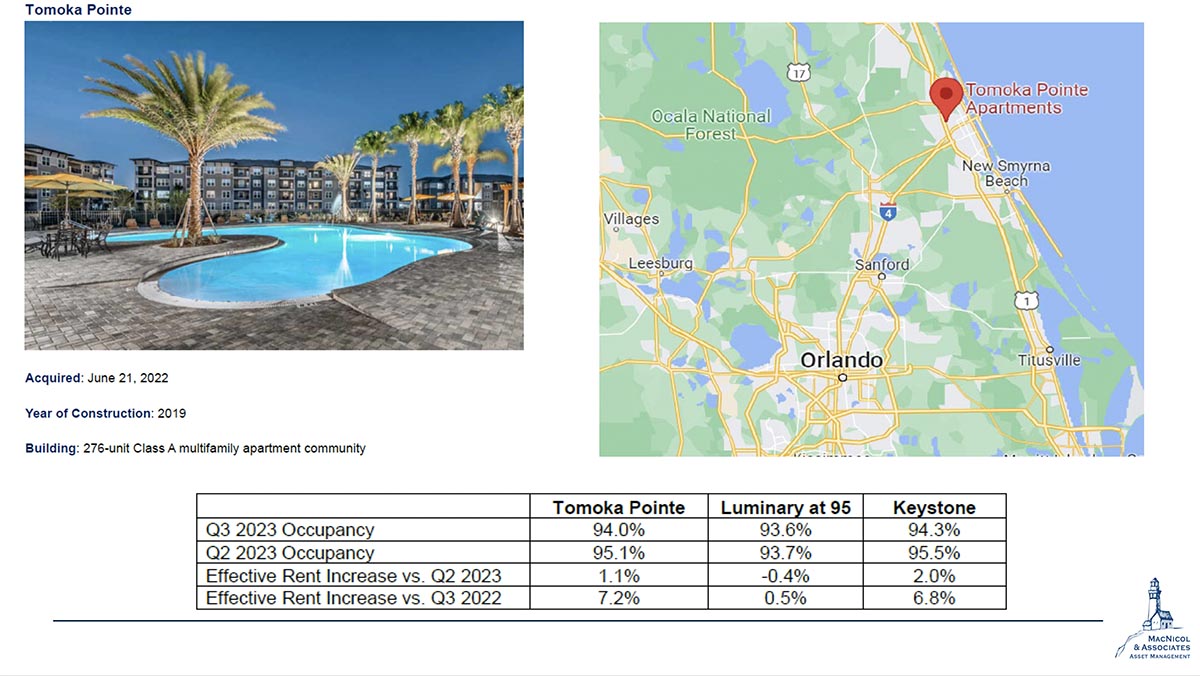
We also have a portfolio of assets up north of Orlando which includes Tomoka Pointe, Luminary at 95, and Keystone. These properties are strategically situated, and that’s a crucial aspect. Acquiring these buildings requires not only a substantial financial investment but also market expertise. This is where Venterra comes in. They assist investors in working through the intricacies of these deals, because closing these transactions is a tad more intricate than one might assume.
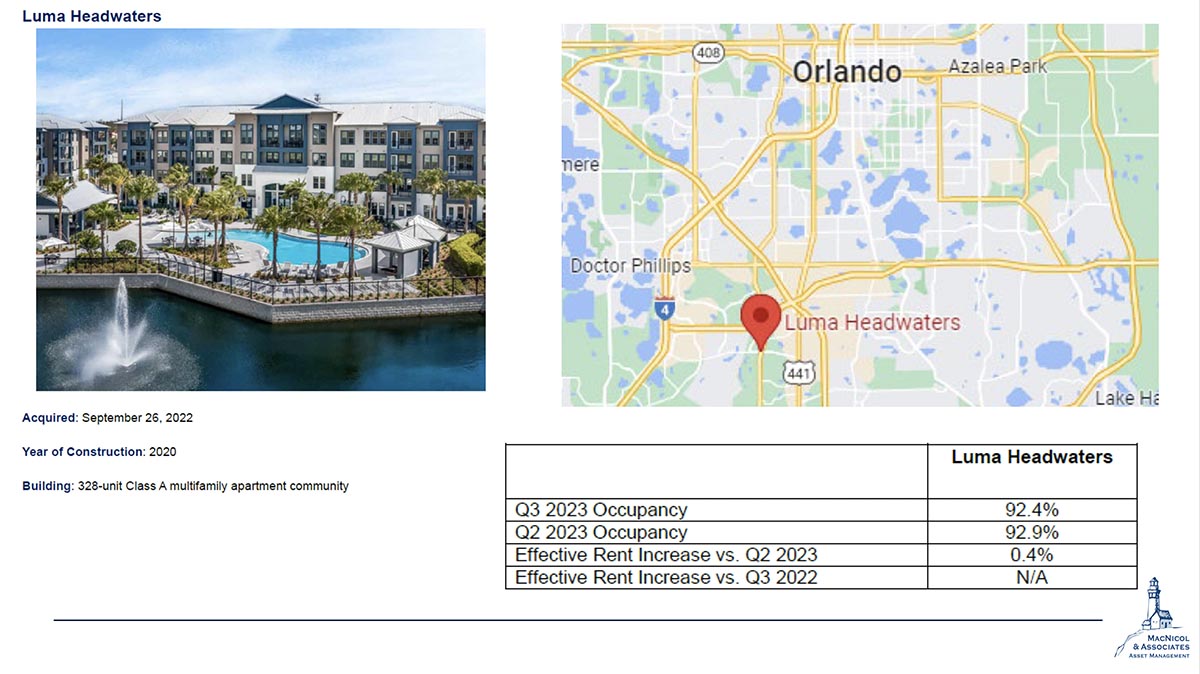
Moving to another great investment, Luma is one of the newer additions to our portfolio. Since it was just acquired around this time last year, there isn’t a direct comparison for the year 2022. But the good news is it’s performing well with 92.4% occupancy!
These are substantial, secure, and strategically located buildings that appeal to most professionals and younger individuals with degrees and secure jobs.
Our partnership with Venterra has produced great results so far and we couldn’t be happier with the turnout of the assets within the portfolio. If you’d like to learn more about the MacNicol Alternative Asset Trust Fund and how this can deliver better returns for your clients, reach out to us and we can discuss how we can best support you.
Market Update
S&P 500
Looking at the S&P, there’s been a noticeable decrease this month. The price objective has also seen a dip, giving us a clear directional signal, and it’s on a downward trend as indicated by its crossing of the red diagonal line.
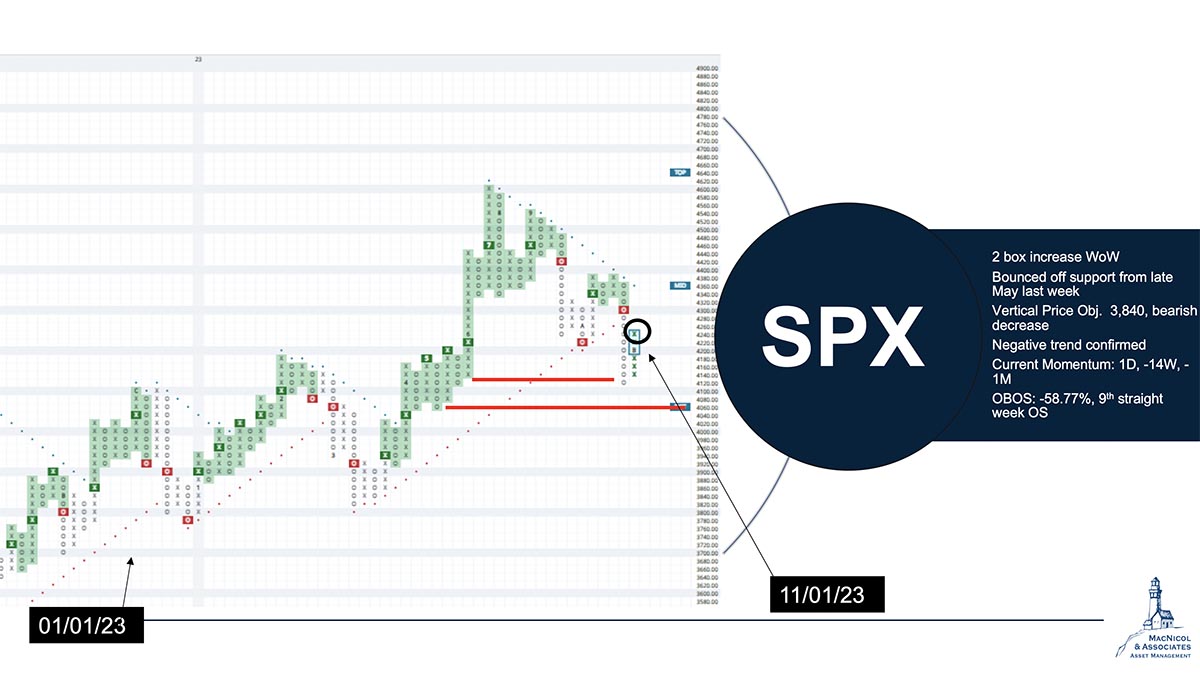
Currently, the upside potential for the S&P seems a bit more muted compared to the previous month or two.
What’s crucial for us right now are the support lines at 4120 and 4060. These have served as support levels in both the recent and not-so-distant past (earlier this month and back in April and May). They act as key points to monitor because if the market can hold steady there, we might avoid a further drop. However, if not, there’s a risk of it descending all the way down to the lows we saw in March. Stay vigilant!
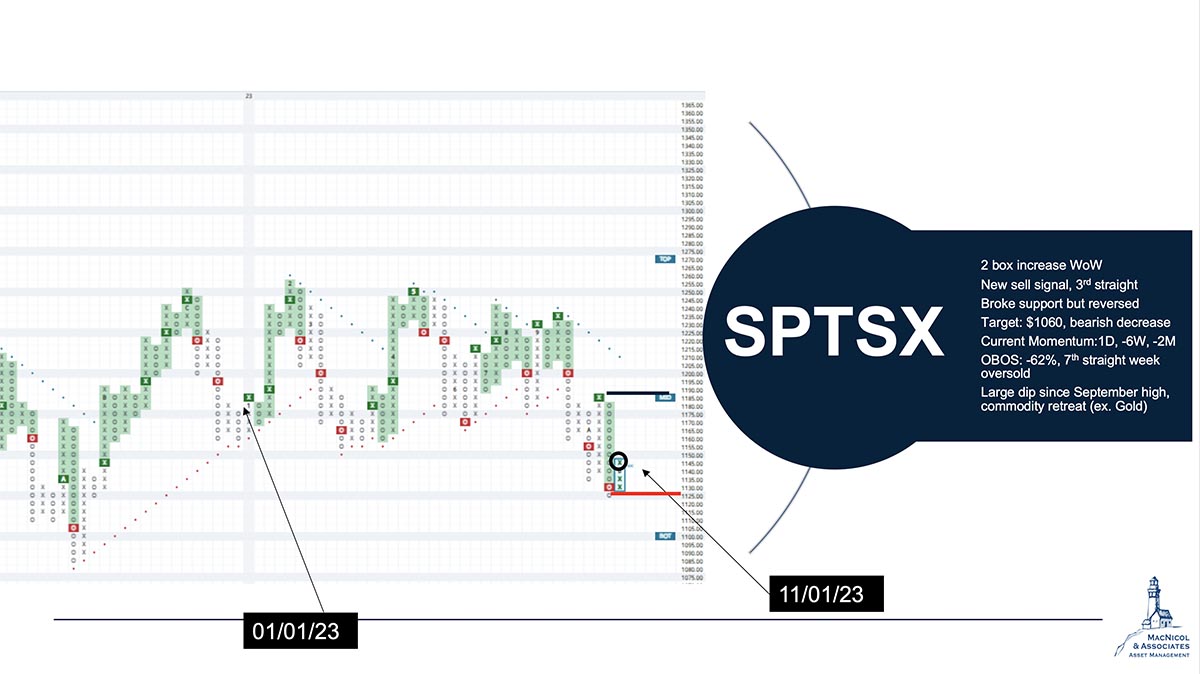
TSX60
A quick look at the TSX60 up north. Similar to the S&P, we’ve seen some action this month – two sell signals with a buy signal squeezed in between. The target price has also taken a dip.
The TSX60 is down year-to-date, erasing the positive momentum we experienced earlier in the year. If you look at the charts from May, February highs, and even those in August and September, it’s been a bit of a downhill ride.
There’s been a large dip since September and this decline aligns with the significant drop in commodity prices, including copper and energy resources like oil and natural gas. Although oil is still trading favourably for producers, the TSX60 seems to be marching to the beat of commodity prices, but with the exception of gold. Gold’s doing well, but interestingly, it hasn’t translated into a positive impact on the overall TSX performance.
Bullish Percentage Chart
Now, let’s break down the percentages of stocks trending bullish versus bearish on the S&P and the New York Stock Exchange (NYSE). Both indices have dipped below the crucial blue line, signaling official entry into bearish territory.
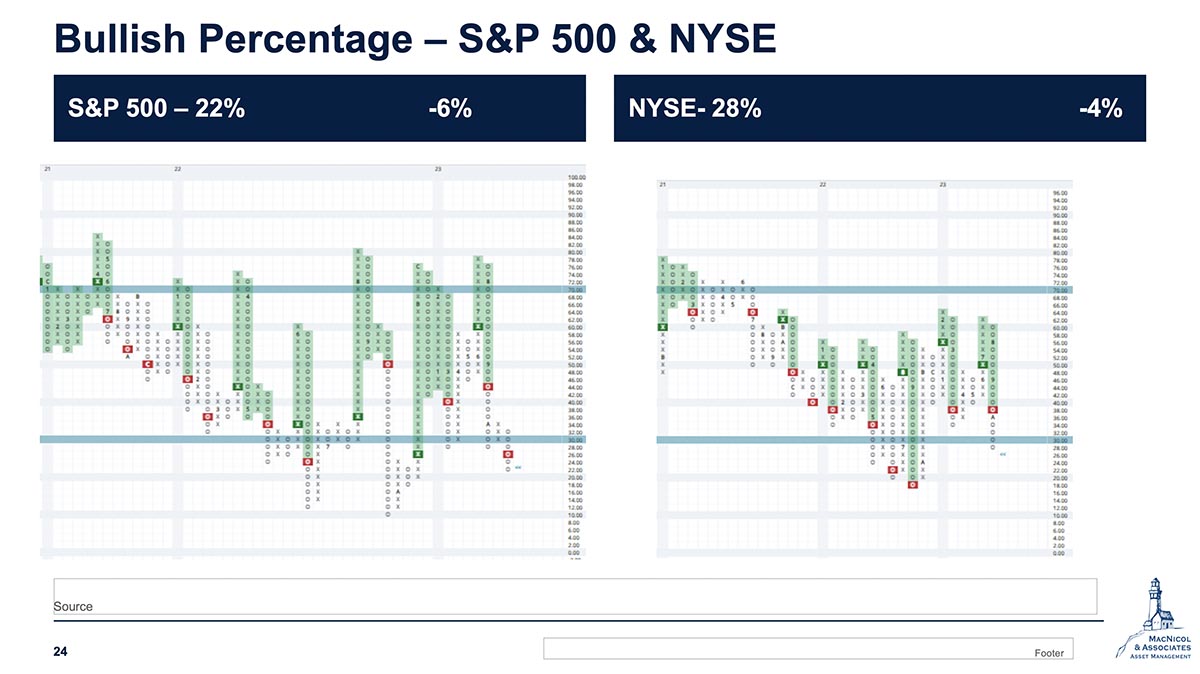
Notably, the S&P has created two consecutive sell signals, a pattern we observed only at the beginning of 2022 during the Russia-Ukraine conflict and, and then prior to that it had three straight sell signals in 2021.
Moving forward, this chart may exhibit some lag, potentially reversing as markets fluctuate.
The NYSE, with its larger and more diverse group, tends to be less extreme in its movements compared to the S&P. The S&P frequently surpasses the 70% bullish level versus the NYSE, which only has done it once in the past three years.
Percent Positive Trend
The percent positive trend chart quantifies the positive trends for each stock within the index. Currently, 46% of NASDAQ-listed companies and 40% of Dow components are trending positively. The flip side shows 60% trending negatively.
These charts suggest a potential reversal on the horizon, and they are notably more elevated than the bullish percentage chart. Our approach involves considering these charts alongside various technical indicators for a comprehensive short-term market movement forecast.
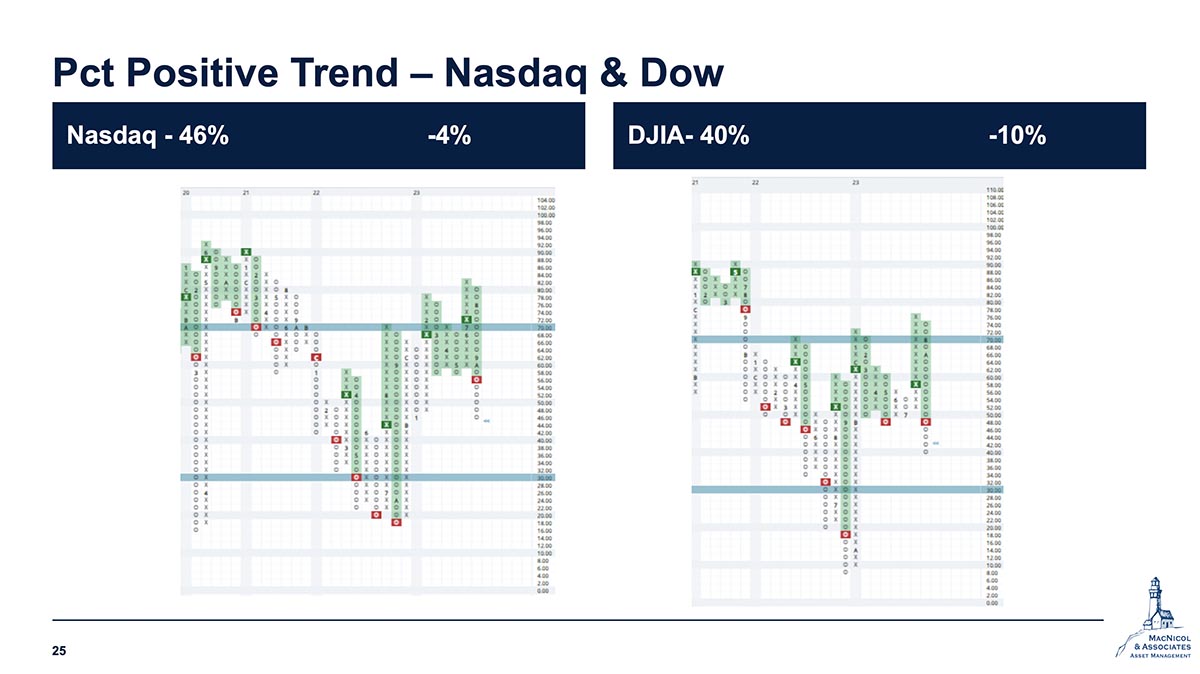
Interestingly, both charts have generated a sell signal, marking the first for NASDAQ since last year. This recent weakness in the tech sector, where some stocks were trading at high multiples, has led to a pullback. However, it’s worth noting that most NASDAQ components have rebounded despite the sector’s recent challenges.
Stay tuned as we closely monitor these signals for potential market shifts.
Asset Class Rankings
Let’s shift gears and dive into our asset class rankings, offering a bird’s eye view of the current landscape. Notable changes include commodities making a significant leap from the third to the first asset class. This surge is attributed to the strength in precious metals and agriculture. Worth mentioning is that energy, specifically commodity funds not commodity equities, lost three buy signals.
Breaking it down further, precious metals are still relatively weak but show potential for an upside. Agriculture funds have gained a little even though some of the agricultural equities are having a tough time right now.
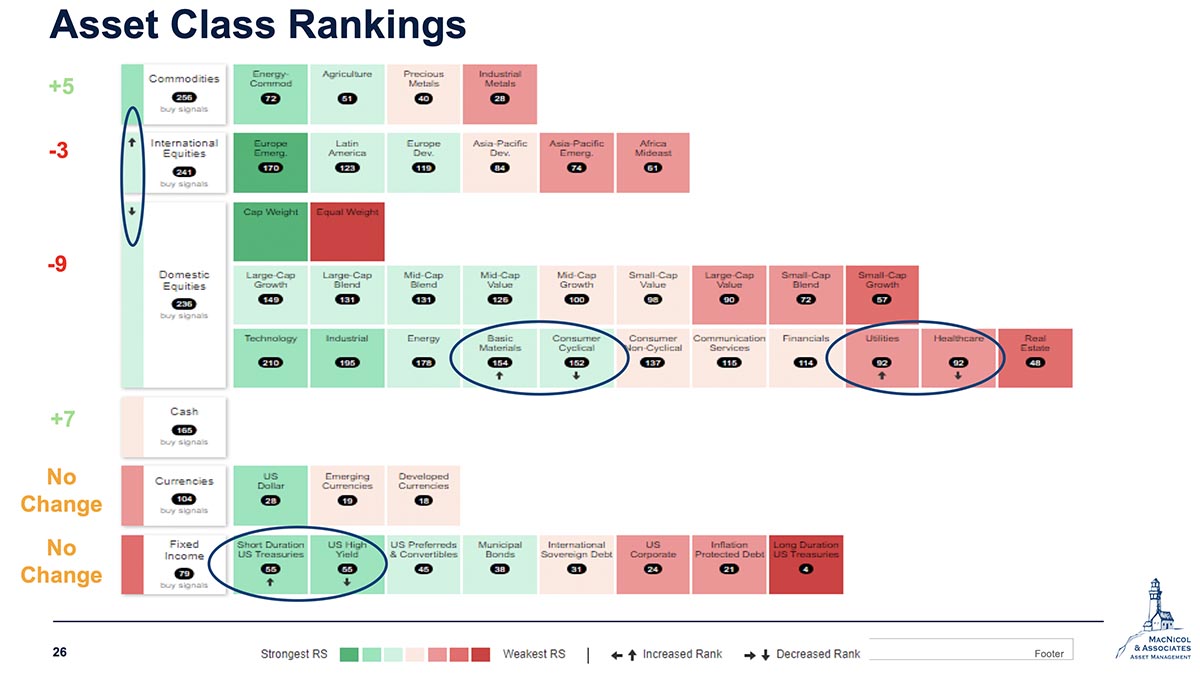
On the domestic equities front, the tech sector has experienced a dip, shedding approximately 25 buy signals over the past four to five weeks. This shift has benefited industrials, which have gained a few signals, and energy, emerging as a significant winner with a notable increase in buy signals.
Meanwhile, consumer non-cyclicals have seen an upward trajectory in the past month whereas consumer cyclicals are continuing to move downward and approaching the non-cyclical area. Of course, the non-cyclical sector is comprised of essential staples that we all need.
These shifts in asset class rankings provide valuable insights into the evolving dynamics of the market, guiding our strategic approach in the weeks to come.
Annual Number of 10% Corrections for NASDAQ100
And to close this month’s market review, let’s have a peek at the annual count of 10% corrections for the NASDAQ 100. Despite the perception of heightened volatility in the market this year, the data tells a different story. We’ve experienced only one correction of 10% or more, which is relatively mild.
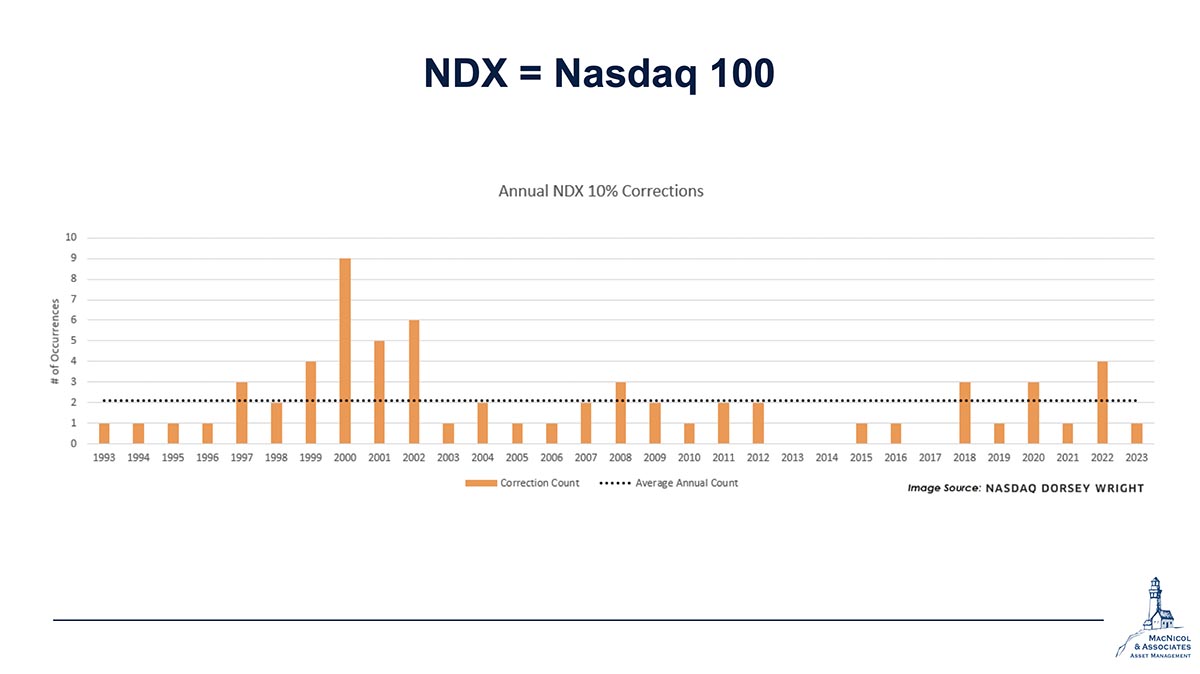
To put it in perspective, historical averages tend to hover around two corrections. In more tumultuous years, such as 2022, 2020, and 2018, we witnessed a significantly higher number of corrections.
If you throw today’s investors back into the dot-com bubble, they might not be able to function as well because we were getting NASDAQ corrections left, right, and center with some of those boosted valuations.
This is a compelling reminder of how market dynamics have evolved, offering both insights and cautionary notes for today’s investors.
And that concludes our November market update. If you have questions or need assistance with your investments, feel free to reach out and we’d be happy to help.
For the most up-to-date market insights and commentary, sign up to MacNicol Market Insights.