

This month’s market analysis delves into the real estate capital markets, primarily concentrating on financing issues rather than the specifics of the properties themselves. Before we proceed with this month’s market update, a quick reminder, the insights shared in this blog aren’t intended to serve as investment strategies or tax advice. The full disclosure statement is available here.
For advice tailored to your individual needs, it’s always best to consult with a financial advisor or other qualified professional.
Alternative Asset Trust Fund Update
Real Estate: Commercial and Private Investments
A significant concern for investors in commercial real estate currently is how interest rates might impact capitalization (cap) rates. Leverage is the key in both commercial and private real estate investment. The process of buying the property and increasing its performance through the combination of the property’s debt and equity to maximize Net Operating Income (NOI).
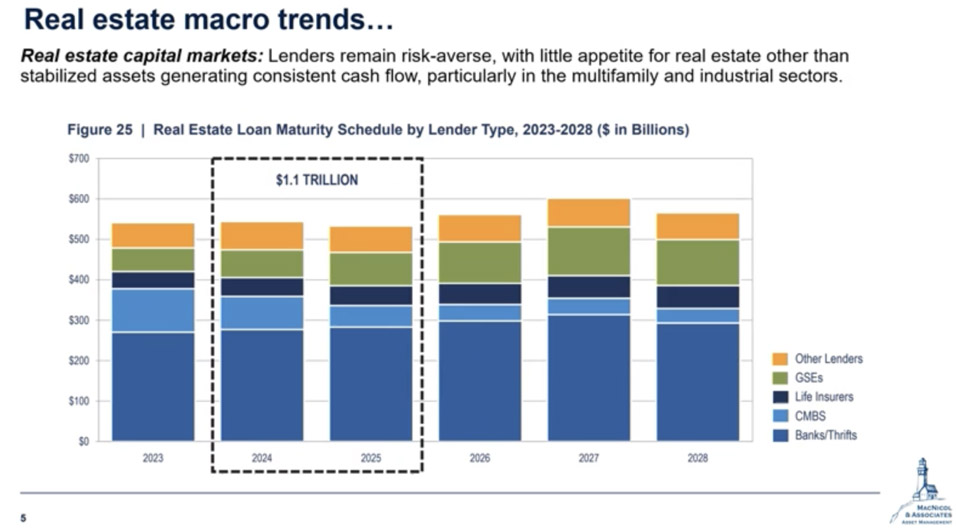
This increase in NOI gains the utmost importance within the realms of determining the fair market value for the property and the loan-to-value (LTV) ratio, thereby allowing further investments and ensuring return for the investors. Presently, lending tends to focus more on existing clients, with a lesser emphasis on new deals.
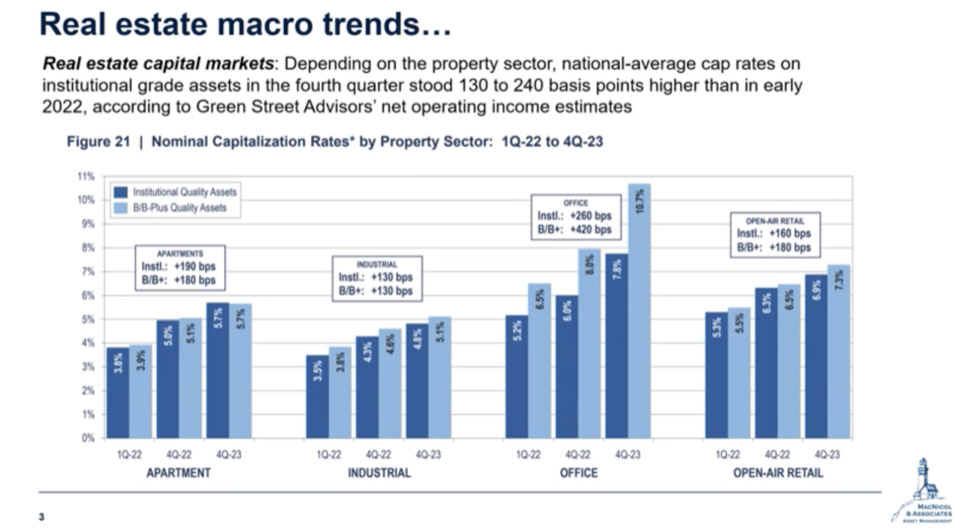
Data from Green Street Advisors, which presents national average cap rates for institutional-grade real estate, suggests that sectors like apartments and industrial properties offer promising investment opportunities.
Under these circumstances, investing in office spaces is not recommended unless one can take a huge risk or the investor is an expert. Office real estate still poses a tough investment with uncertain occupancy rates and non-institutional tenant defaults. People are now questioning the sense in having very expensive office spaces 90% empty most of the time.
Real Estate: Transaction and Volumes
The debate now shifts to real estate transaction volumes. We have a more in-depth market analysis discussion about this available behind a login credential. The key piece of information within the presented data is contained in small, bright orange bars that represent the annual transaction volumes by property type.
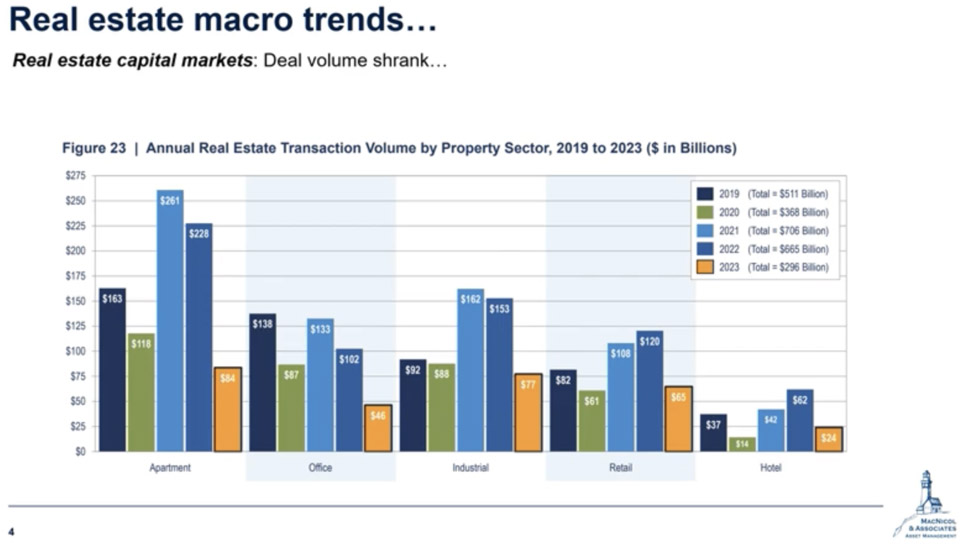
Insights from Rockwood Capital reveal a current trend of caution among lenders, particularly regarding large-scale development projects. The focus should be on the cumulative volume charts from 2019 to 2023. While individual years like 2020, impacted by COVID, show reduced activity, the overall trend in recent years has been a significant drop in transaction volumes. Even compared to the COVID period, the current transaction volume, particularly in 2023, is remarkably low, highlighting the influence of interest rates and market conditions in various sectors of the real estate market.
Looking at this chart, it also proves that the creditors are still in a risk-averted situation, just as investors in the stock markets, preferring low-risk blue-chip stocks rather than the highly risky small-capital stocks. The only issue is that in real estate, it looks very much like most lenders doing business largely with their existing and trusted clients while focusing largely on very familiar asset classes, such as multifamily residential and industrial properties. This trend is echoed in the strategy of the Rockwood group, emphasizing lending primarily to established asset classes. There’s a projection for a more balanced approach between multifamily residential and single-family properties within the next year. This shift is a response to active involvement in the market and adapting to the evolving demand. This balance aims to meet the growing demand in different real estate segments.
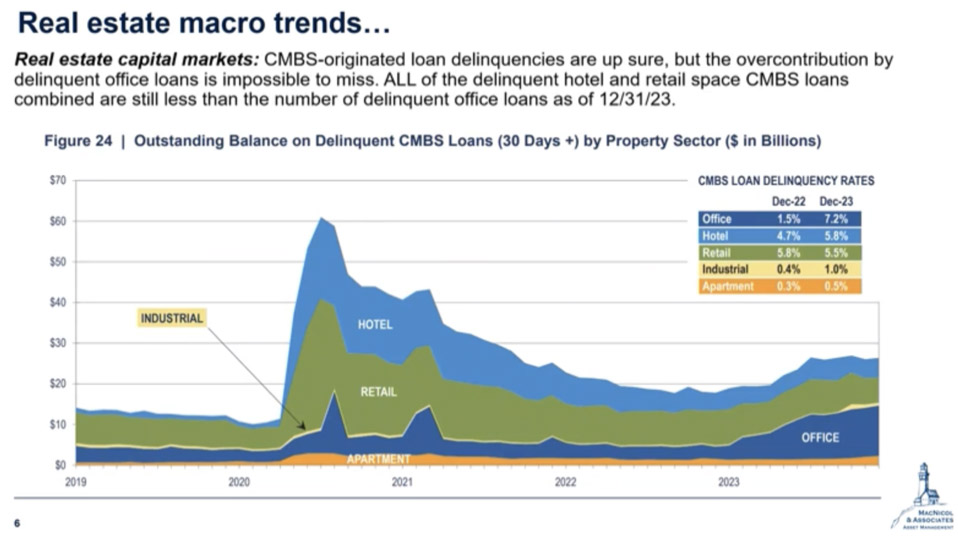
This part will throw light on one of the most vital issues to the capital markets for real estate: Collateralized Mortgage-Backed Securities (CMBS). CMBS is a commercial real estate loan, which has been securitized into securities. Their performance, particularly the delinquency or default rates, is a crucial indicator for investors and portfolio managers in assessing the attractiveness or riskiness of specific areas in commercial real estate. It’s important to understand that commercial real estate is not a single asset class, but rather comprises several subcategories.
During COVID, there was a significant spike in CMBS loan delinquencies, which is particularly evident in the office space sector. By December 2022, the delinquency rate in office space loans had surged to 7.2%, exceeding the cumulative delinquency rates of retail and hotel loans. This data underscores the importance of thorough research and caution in investment decisions. For any uncertainties, it’s advisable to seek professional investment advice.
Market Updates
Public Markets: NDX
Switching attention to the public markets, the focus is on the recent performance of the Nasdaq, especially the semiconductor sector. Contrary to general perception, it’s not the broader tech sector but specifically semiconductor companies that have driven the Nasdaq’s growth this year.
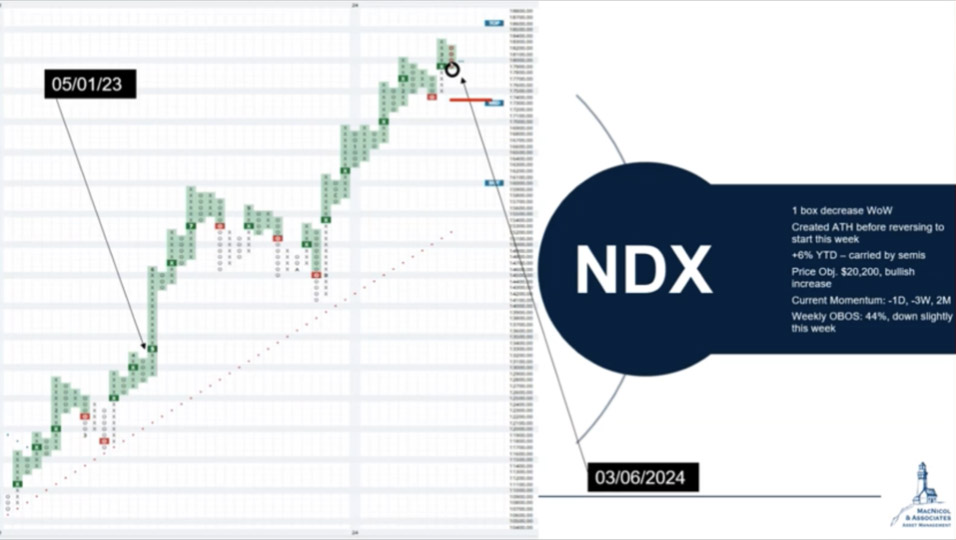
Companies like Nvidia and its competitors have shown remarkable performance, though there’s a noticeable decrease in investor demand compared to the start of the year. Companies like Nvidia, its rival showed brilliant performance, though there is some fall in demand by investors compared to those at the beginning of the year.
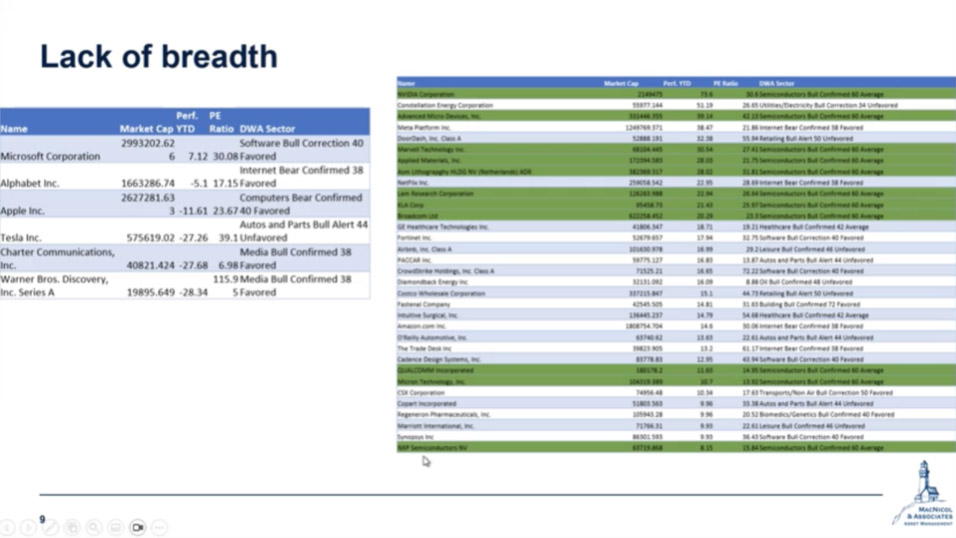
Leading the group from the chart: Nvidia. But with them, several other semiconductor firms are showing very strong performance. On the other hand, even the greatest companies worldwide, such as Tesla, Apple, Alphabet, and others, have not fared as well this year in comparison to the previous one. For example, Apple has had some weakening that was enough to force them to change their investment positions. Similarly, Alphabet is experiencing a slowdown. These outline the dynamism involved in the performance of the market and at the same time point out the key leading sectors and those that take a backseat at the time of the report.
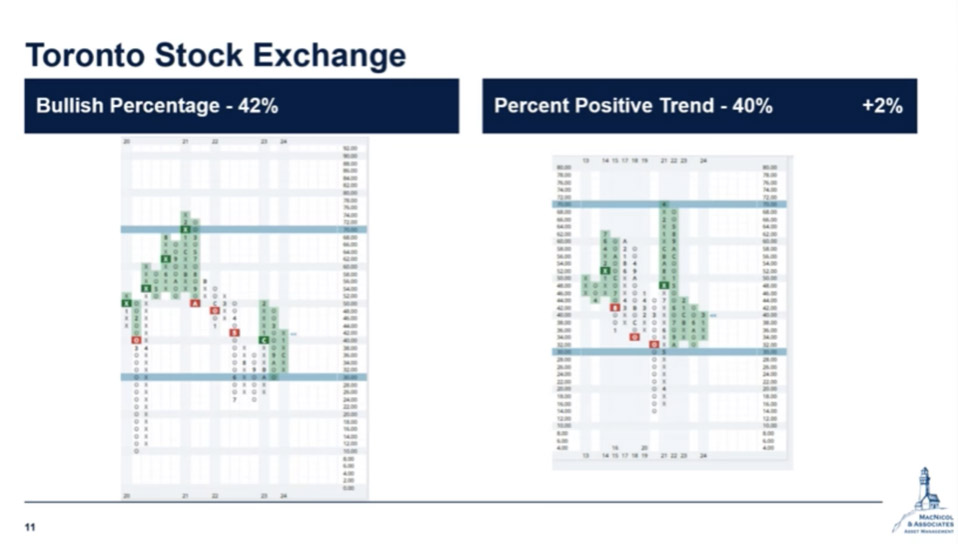
TSX60 Breakout and Prospects
Analyzing the TSX sixty, there’s a notable bullish trend as it has broken out of a two-year channel. There’s potential for significant growth, especially if it surpasses the 1340 line, its all-time high from 2022. Recently, commodities like oil and natural gas have shown strength, with natural gas possibly hitting a bottom.
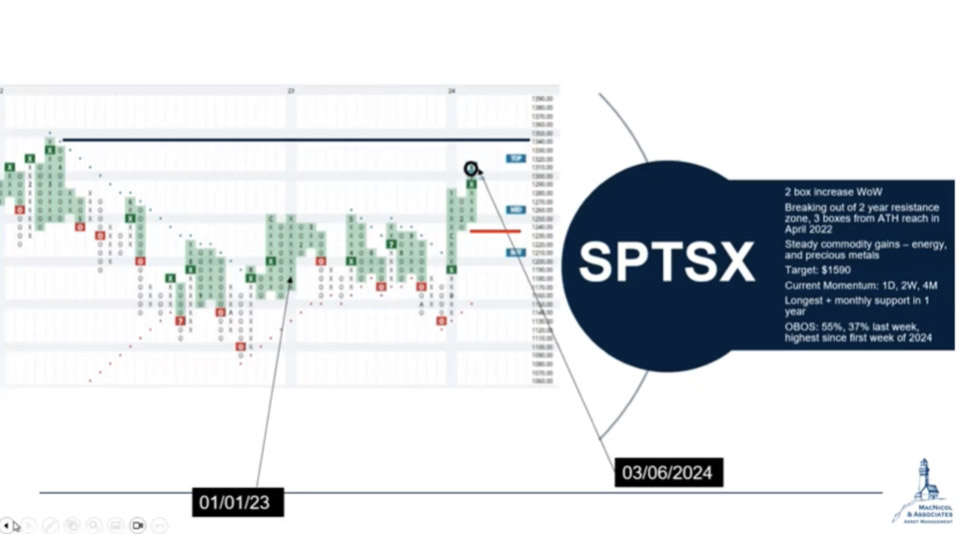
A positive aspect of the TSX is the technical indicators, which have reversed from their lows and are showing upward movement. This suggests considerable potential for growth in the Canadian equity markets.
Pivoting to the economy, based on a chart from Canaccord, despite the Federal Reserve’s recent tightening, there’s still a net loosening in the U.S. economy.
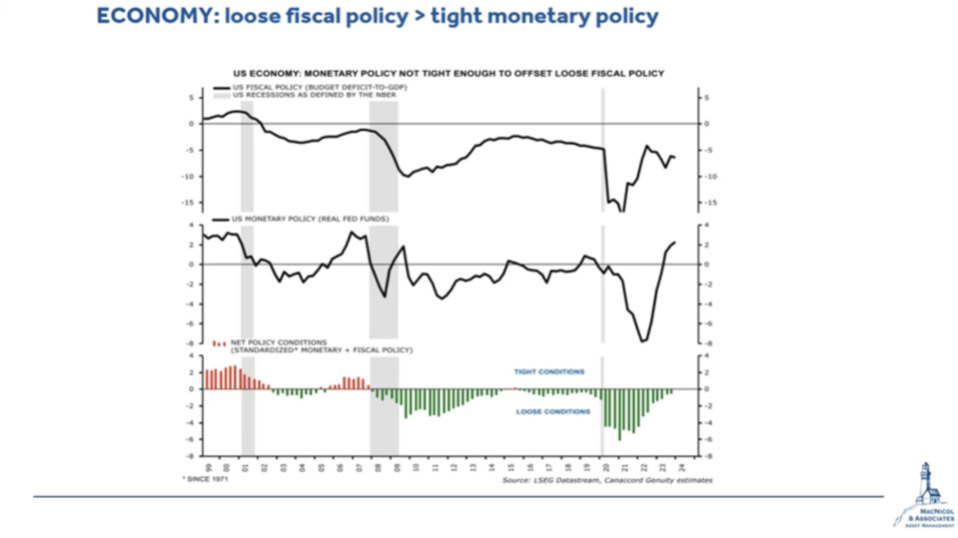
Such has been the trend seen since 2008. Canaccord’s analysis predicts that the Fed will maintain higher interest rates for an extended period, aiming for real rates around two percent. Future CPI readings will determine the possibility of rate cuts.
Gold’s Performance
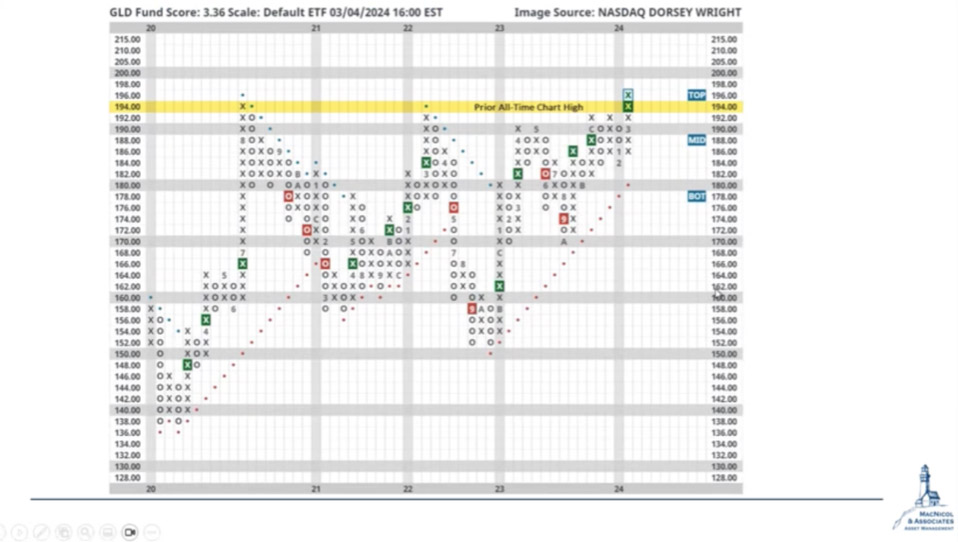
Gold, is the standout performer, having reached an all-time high and, thus, creates a signal to buy with a target of 178-182. The fund scores at about a 3.3 out of 6, but there’s visible upside, particularly in physical gold and the mining stocks expected to catch up.
Gold has moved up recently, and expected cuts in interest rates this year may make the metal more attractive than high-yielding investments.
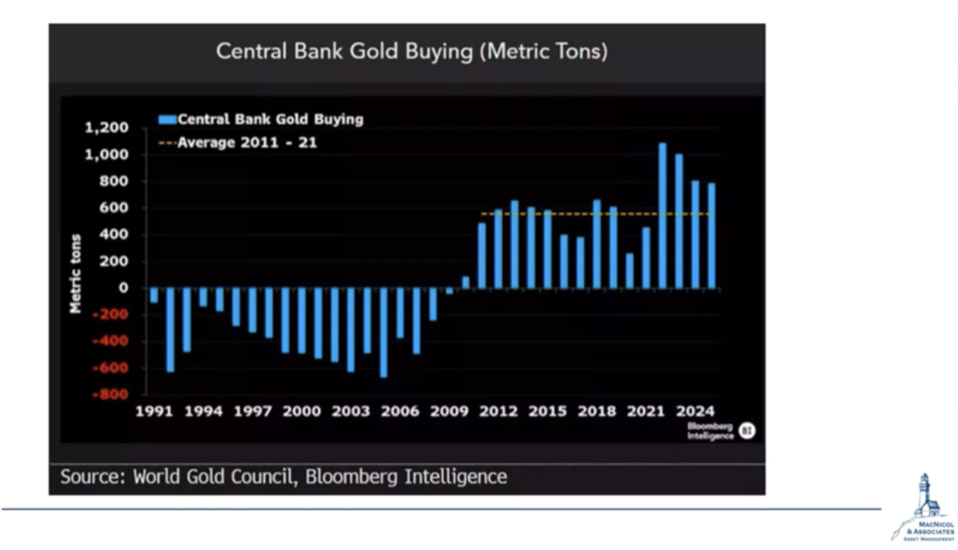
And, in essence, the central banks are more and more investing in gold, especially since the U.S. and the EU blockade on capturing Russian foreign reserves of about 300 billion after they invaded Ukraine. This could signal a shift from U.S. treasuries to gold by countries not closely allied with the U.S. and EU.
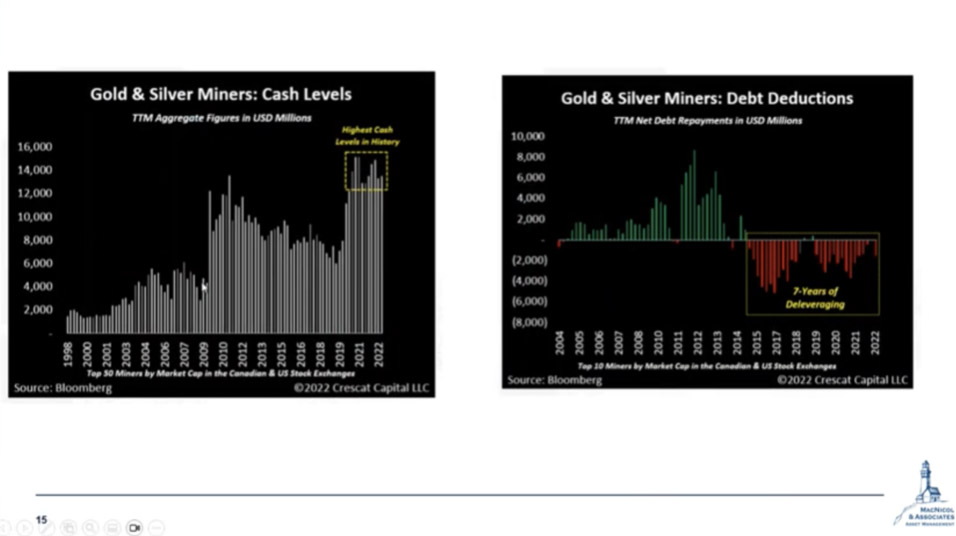
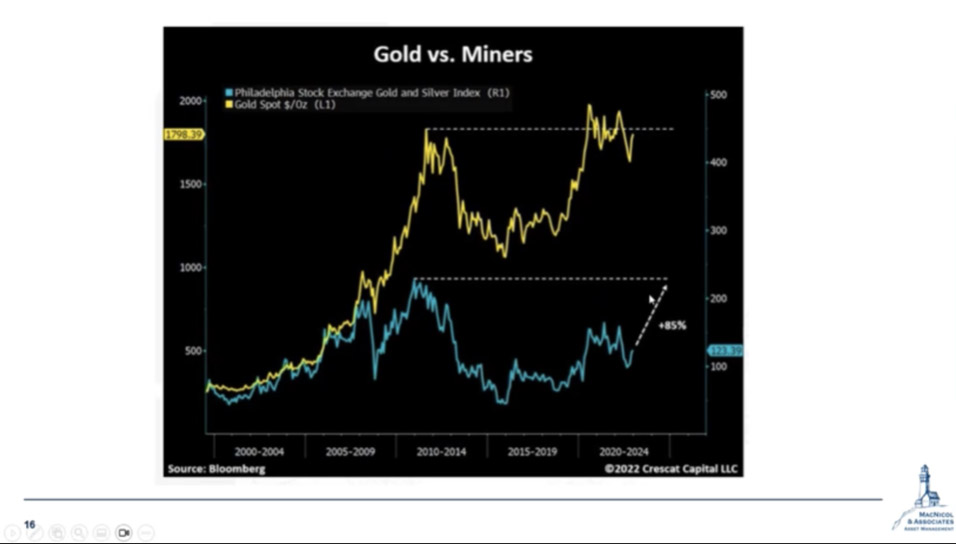
As of now, gold and silver miners represent quite favorable investments since their balance sheets are among the cleanest in years, their cash levels are high, and their debt loads are reduced. They have compelling valuations to support even the most bullish of scenarios.
This last chart shows the spot price of gold against the gold and silver mining index. The spot price is within close range of its last cycle high, but the mining index has about 85% to run to that. That chart from Crestcat helps with investments in mining.
And with that, we conclude the following market commentary. To learn more about public and private investment opportunities, contact us at info@macnicolasset.com or visit our website at https://macnicolasset.com