
Share This Post Today!
Eldred Rock Lighthouse, Alaska, U.S.

This lighthouse is a historical octagonal lighthouse. It is the last of ten lighthouses built in the early 1900s before 1906 in Alaska. The lighthouse was eventually automated in 1973 and stands at 17 meters tall.
Fisgard Light, Colwood, British Columbia

This historical site is located on Vancouver Island. It was originally constructed in the 1860s and sits near an artillery fort. The lighthouse has been automated since 1929 and is now classified as a Canadian National Historic Site.
*Feel free to send us your photos of Lighthouses to be featured in our weekly market observations.
Holiday week
As we ended a shortened workweek with Canada Day and U.S. Independence Day celebrations, markets saw lighter volumes and reduced activity, as Canadian markets were closed on Wednesday and U.S. markets on Friday. This period offers a timely moment to reflect on the enduring values of independence, resilience, and opportunity that underpin both Canada and the United States. We would like to wish all of you a safe and enjoyable holiday and thank you for your continued trust.
We will also say we are cheering for the Canadian national soccer team as they gear up for their round-of-16 match on Saturday against Morocco. All eyes across Canada and the soccer world will be on the game!
For those interested, I came across this on Instagram. It shows the amounts each team earns at the World Cup.
https://www.instagram.com/reel/DZ-o0KqRZi2/?igsh=MWw0Ymp2d29kNmRmcw==
SpaceX index inclusion
This past Monday, SpaceX was added to the Russell 1000. After the company became public and became one of the world’s most valuable companies, indices are rushing to include the company in their mix. Just a few weeks ago, Nasdaq changed its index inclusion rules to include SpaceX faster. SpaceX will reportedly join the Nasdaq 100 as soon as July 7th.
Some analysts argue that SpaceX being added to the Russell 1000 is a minor catalyst for the stock. It is a minor catalyst as the amount of money indexed to the Russell 1000 is in the billions, not the trillions like the S&P 500. The S&P 500 will not include SpaceX in its index until at least June 2027 due to share availability in the market. Currently, there is a limited number of shares trading in public markets, with more stock becoming available in six months. Despite that, many believe this inclusion could help SpaceX shares, which have pulled back in recent sessions. Shares have pulled back since a red-hot debut where shares traded up to $225/share. Today they sit in the high $150s, and SpaceX’s valuation is about $2 trillion.
We think share prices have faded for a variety of reasons, including investor sentiment, valuation, and overall market volatility. We also believe SpaceX’s massive debt issuance last week is worrying investors as they raised $25 billion in senior unsecured notes ranging from 5 to 30 years in maturity. The company said it would use the net proceeds to “repay the outstanding borrowings under its bridge loan facility in full, to pay related fees and expenses, and any remaining amount for general corporate purposes.”
The debt raise was initially well received by the bond market but has since resulted in a rapid selloff in the secondary market, recording roughly $305 million in paper losses shortly after issuance. The debt issuance has also raised diversification questions from market strategists, stating that SpaceX equity and debt face the same execution risk and that the company’s losses and capex needs could be an issue in select market environments. We will also say this is one of the largest AI-related debt issuance’s ever.
We continue to follow SpaceX extremely closely as its massive IPO is fascinating and continues to dominate market news.
Media deal blitz?
On Monday, Comcast announced that it would be separating its company into two businesses, splitting its NBCUniversal Media, entertainment, and theme parks business from its cable and broadband operations in a spinoff. The spinoff will occur in about a year. Shareholders took this news very positively as Comcast shares moved up 6.5% on Monday. Comcast shares trade at a significant discount known to market participants as a conglomerate discount – where businesses in numerous industries trade at a discount to a sum-of-the-parts valuation. Comcast’s two businesses also lack clear synergies between the two main businesses, which also drives the discount.
For years, leadership has resisted spinoff pushes from investors.
The announcement by Comcast led to speculation by many market participants that this spinoff could lead to more deals in the media industry involving conglomerates. This spinoff could also spur interest from other media companies like Netflix, which could have major interest in NBCUniversal after losing out on a bidding war for Warner Bros. Discovery.
The spinoff will lead to a pure play on cable and broadband, which has sparked speculation regarding a combination of these assets with competitor Charter Communications, whose shares have been lagging for quite some time. Cable and broadband stocks as a whole have been under pressure due to heightened competition in broadband. Companies like Comcast and Charter have seen subscriber losses, pricing pressure, and rising competition from fixed wireless services offered by T-Mobile, fiber broadband from AT&T, and SpaceX’s satellite service.
We do not have exposure to any of the companies named above but follow them very closely. We think the spinoff is positive for shareholders as the transaction could unlock value from the current share price discount. The deal could also spur deal activity in the media and broadband industries, where there are numerous potentially intriguing transactions that could eventually occur.
U.S. underperformance
For the first time since 2008, the S&P 500 has underperformed its global peers in the first half of two consecutive years. Last year, the underperformance in the first six months was 10.6%, the worst figure for U.S. underperformance since 2009.
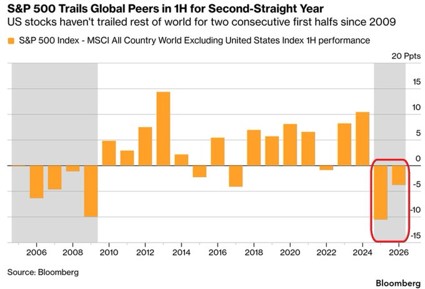
The S&P 500 has had its slowest start to the year since 2022. We are not surprised by this due to the U.S. market’s strength in recent years. It has been flat-out soaring while many international equities have been out of favour. These international names remain much more attractive from a fundamental standpoint, and their technical charts have improved as well. Historically, international names and U.S. names alternate periods of outperformance. After the recent U.S. outperformance and the fundamental attractiveness of international equities, we have been bullish on various international equity markets for quite some time. These are major reasons why we have added equity exposure in client portfolios in Asia, Latin America, and the Emerging Markets within the last 3-4 years. We will not dive any deeper into our thesis for these regions this week, as we have talked about these investment themes in public in depth in the past.
If you do not believe that U.S. names are historically expensive, take a look at this chart, which we saw in a newsletter this past week. The chart tracks the earnings yield on the S&P 500 over the last 100 years+. Currently, the earnings yield is near 100-year lows. The only other periods that the earnings yield has been in this range were in 1929 and 2000. For those of you unfamiliar with earnings yield, it is the inverse of the price-to-earnings ratio. It measures the percentage of each dollar invested that a company earns in a year. Over the long term, it is a much cleaner ratio than the P/E due to negative or zero-earnings companies.
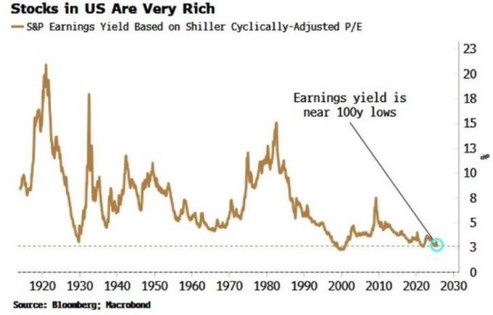
Regardless of how you look at it, the U.S. market is historically expensive, and we expect that to remain a fact for quite some time. The S&P 500 and other U.S. indices will get even more expensive when they add the likes of SpaceX, OpenAI, and Anthropic to their composition, as they are behemoths with relatively minimal revenue and earnings.
When you look beyond the headlines and the AI names (in the U.S.), the market is much weaker than the headlines suggest. Some AI names are up 200% this year and are all anyone can talk about. Think about Micron this, Sandisk that; it’s a massive theme being tracked and piled into by institutional investors, the media, and even retail investors.
We are in no way stating that we are in a bear market; we are simply stating that strength is quite concentrated and breadth for now is very limited. Both of these facts have been confirmed over recent months through our technical indicators that we track through a platform developed by a Nasdaq company.
Overall U.S. equity sentiment remains elevated as the Goldman Sachs Investment Research US Equity Sentiment Indicator sits at its second-highest level since 2021. The indicator combines nine measures into a single score utilizing individual, institutional, and foreign investor data. According to the data, a reading above 1.0 signals stretched positioning; today the indicator sits at 2.0.
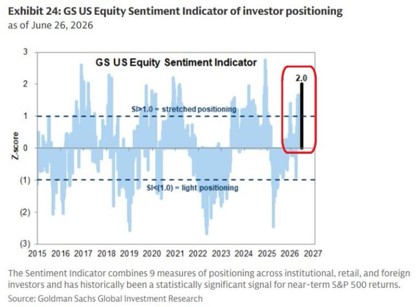
When positioning gets this stretched, the market usually needs very little to trigger a correction.
When HODL does not work
The HODL principle is a phenomenon in today’s markets where retail investors hold onto an asset instead of selling it, regardless of market volatility. It essentially represents a long-term buy-and-hold strategy. An institutional investor who has used this strategy is Michael Saylor, the founder and CEO of MicroStrategy (now known as Strategy), the technology company that provides business intelligence and mobile software, which has reinvented itself in recent years. Saylor uses the HODL strategy with Bitcoin; he has become a very popular Bitcoin investor who has turned his company into a Bitcoin conduit. His firm has raised billions in order to buy Bitcoin. He has claimed he will never sell Bitcoin as it will eventually reach higher levels. For six years, Strategy has been a buyer of Bitcoin after establishing Bitcoin as its primary reserve asset in 2020. Since then, they have used cash flows, equity issuances, preferred share sales, and convertible bond sales to buy more Bitcoin.
That, however, changed over the last month. On June 1st, Strategy stated that they had sold 32 Bitcoins at the end of May. This sale looks like it could not be done in isolation, as Strategy’s board made a big filing this past Monday.
In the filing, Strategy stated that they could begin to sell Bitcoin to build up their U.S. dollar reserves in order to fund repurchases of the company’s common stock. The board of directors has already voted to approve this plan. The company termed this a Bitcoin monetization program. The move comes as Bitcoin has struggled over the last year. Strategy said it plans to buy back $1 billion worth of Digital Credit Securities, which refers to its preferred stocks, and to repurchase $1 billion of common stock. The company said the programs don’t have fixed expiration dates.
Last week, Strategy raised $1.15 billion through common stock issuance but announced it had not added to its Bitcoin holdings. Instead, they reported a boost to its U.S. dollar reserves. Strategy currently holds 4% of the total Bitcoin supply but is sitting on a massive unrealized loss with Bitcoin’s price decrease in recent months.
With this alteration to Strategy’s strategic plan, does the outlook for the firm change? We think it does and could provide some support for shares if the price of Bitcoin remains stable in the short term. However, Strategy is running out of capital, and many investors are concerned about the company’s dividend payments, considering its legacy software business brings in comparatively little revenue, and the company has issued billions in preferred shares to buy more Bitcoin. This could lead to more potential sales as Strategy’s access to capital could continue to dry up. Regardless of what you think of Saylor and his company, it is a fascinating case study.
We will conclude by saying the company is way too risky for our investors, so we will continue to watch from the sidelines.
Over the last year, Strategy shares are down 78%.
What we are looking at next week:
Markets enter the week of July 6th with investors likely focused less on the economic calendar and more on whether the market’s technical strength can continue through the early stages of the third quarter. The primary macro event will be the release of the FOMC meeting minutes on Wednesday, which may provide further insight into the Federal Reserve’s thinking following its recent hawkish tone. With major indices continuing to trade near record highs, investors will be watching closely to see whether momentum remains firmly intact of whether this consolidation period is it for the current rally. Market breadth and sector leadership may become increasingly important as investors assess the sustainability of the current rally.
Commodity markets will also remain in focus after gold and silver experienced notable pullbacks over the last few weeks. While easing geopolitical tensions and reduced safe-haven demand have pressured precious metals, the longer-term fundamental backdrop remains largely supportive. Whether capital continues to flow into technology and growth stocks or begins and rotating back into commodities and defensives may become one of the more important themes to watch as investors get ready for the second half of the year.
MacNicol & Associates Asset Management
July 3rd, 2026
Download in PDF format: