

The two main purposes of a Lighthouse are to serve as a navigational aid and to warn ships (Investors) of dangerous areas. It is like a traffic sign on the sea.
 Sentinel Island Light, Juneau City, Alaska
This lighthouse is located at the northern entrance to the Favourite Channel, between the mainland and Lincoln islands. The lighthouse was constructed in 1902 out of concrete and was automated in 1966. The 51-foot lighthouse was added to the National Register of Historic Places in 2002.
 Tree Point Light, Alaska
Tree Point Light is located near the southernmost point of mainland Alaska. The lighthouse was first constructed in 1905 and was automated in 1969. The lighthouse stands at 18 meters tall.
FED member speaks
Federal Reserve Governor Christopher Waller prepared remarks on inflation, interest rates, and more on Tuesday in front of the Peterson Institute for International Economics.
Waller gave some color on what the FED is exactly thinking at this juncture, so we wanted to share that in case you missed his statements.
Waller said that the FED’s progress on tamping down price growth (inflation) has resumed after a few months of it increasing. He said that lower inflation will allow the FED to slash rates but that the FED still needs a few months of good data to justify a cut. Waller went on to say that he believes further increases in the policy rate would be unnecessary as the FED sees inflation decelerating moving forward.
Waller said he expects some moderation in economic activity moving forward pointing to the latest retail data that reported sales as flat in April. He also pointed to credit card and auto delinquency rates being above pre-pandemic levels, signaling some household financial stress.
Waller also said he and the FED are also closely watching manufacturing and nonmanufacturing production data.
Waller also took a moment in his statement to recent criticisms of the FED. Many critics have claimed the FED is now too ‘data dependent’. He simply stated that the FED and its members are not overreacting to any one piece of data.
Regardless of how you feel about the FED, we think rates will remain more elevated in coming years than they were over the last few years (before rates were hiked to combat inflation). We think 0-1% interest rates are a thing of the past and are unsustainable. We also believe inflation will have waves over the next few years where it rises and falls in cycles and remains a problem for consumers for much longer than many think. We think inflation will remain a problem due to the globe’s growing population, decreased cap-ex spending, nationalism which is fueling trade wars, and increased government regulation.
Regardless of how you feel, it seems investors will get the rate cut that they have been hoping for some time in the late summer or early fall.
And just like that a day after we wrote about Waller’s comments, the FED minutes from the last FED meeting were released and they were much more hawkish than many thought. Multiple FED officials mentioned more potential hikes, and that higher rates are not impacting consumption like they used to. There was also chatter at the meeting about the FED not being able to reach the 2% inflation target. This is bearish news for investors and markets took a turn after the minutes were released.
This section has opposing viewpoints and the pieces of it were only written a day apart. Regardless of how you feel, we think higher for longer is the most likely outcome. That does not mean we will not get a rate cut at one point in 2024. We simply think the magnitude of cuts will be smaller and the frequency of cuts will take much longer than many originally expected.
American milestone
For the first time in history, it looks like the U.S. government’s interest expense will be larger than its defense budget. Yahoo has forecasted interest payments to surpass defense spending as the third largest category of spending for the U.S. government.
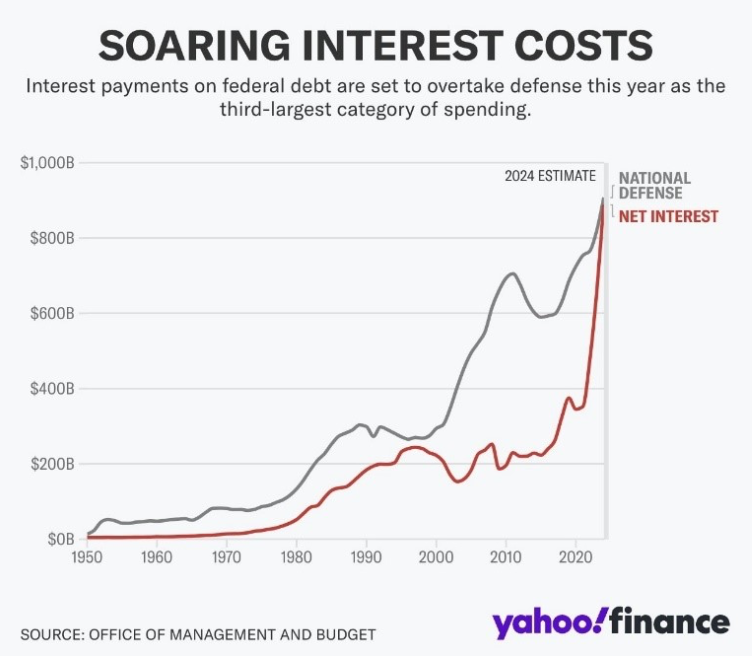
The cost to service debt has surged over the last 2.5 years as the U.S. government has hiked interest rates to multi-decade highs. These rate hikes are due to inflation running rampant which was caused by unprecedented government spending, money printing, and huge deficits in the budget.
With rate cuts hopefully coming soon, the U.S. government might be the biggest winner.
If this trend of record deficits and moderately high rates continues, the U.S. government may be forced to cut spending in other places to be able to service their debt.
Either way, we hope you do not run your balance sheet like the government runs theirs.
Desperate times, desperate measures
Despite the recent pullback in oil prices to the high $70s, consumers are still feeling the pinch at the pump. At these price levels, there is no demand destruction, cash flows are juicy, and profits are up for producers. As oil investors, we are content with the current price of oil but would like a rebound as we head into the summer into the mid-80s. Beyond, the profitability of oil producers, it seems politicians are feeling the wrath of their voters. Voters are fed up with higher prices and are not happy at the pump.
This week, the Biden Administration announced they will be releasing 1 million barrels of gasoline ahead of the July 4th weekend. The Department of Energy says this release is timed to maximize the impact of prices at the pump this summer.
Believe it or not, this is long-term bullish for oil as the government is showing how desperate they are, oil reserves are being depleted even more, and they see higher prices on the horizon.
Gasoline futures have risen 19% this year as crude prices have risen due to OPEC production cuts and fear of a wider war in the Middle East.
Position yourself accordingly, we continue to monitor our energy holdings and the macro environment. We remain bullish and believe most energy stocks trade extremely inexpensively and are headed for higher highs.
Another wrinkle for the oil industry will be the 2024 election where the two candidates will have opposing viewpoints on energy policy. However, we expect Biden’s approach to be more moderate than during the run-up to the last election as prices in his first term have been elevated due to the overregulation and restrictions placed on the industry.
Disclaimer: MacNicol & Associates Asset Management holds various stocks that operate across the energy, oil, and natural gas industries.
Buying at a low
As our investors know, we are bullish on some emerging markets. We have bought ETFs in Mexico and Korea for our investors and continue to look at a private Indian Fund for some diverse exposure in the world’s most populous country. We like these two countries to gain while China suffers from trade restrictions. Companies are moving operations and diversifying operations globally to minimize their Chinese exposure. We think these two economies are growing at rapid paces and have all the tailwinds to continue developing at a fast pace over the next decade. The innovation we are seeing from industry experts is something that we cannot ignore. We also like how cheap equities in these two countries as well as most Emerging markets trade. They are relatively cheap versus developed nations and cheap compared to their historical averages.
-
The iShares MSCI India ETF trades at a P/E ratio of 24.66
-
The iShares MSCI China ETF trades at a P/E ratio of 15
-
The iShares MSCI Mexico ETF trades at a P/E ratio of 11.4
-
The S&P 500 trades at a P/E ratio above 28
-
The Invesco Nasdaq 100 (QQQ) ETF trades at a P/E ratio of 33
As you can see the large emerging markets are cheaper than North American markets. Indian equities are trading a little more expensive due to their recent run as well as larger growth prospects which justify the high ratios. The same can be said for smaller emerging markets, they are very cheap and are historically cheap versus their historic averages.
Emerging markets have also underperformed North American markets by quite a margin over the last 10-15 years. The relative underperformance is quite telling for emerging markets versus the S&P 500 when you put it on a graph.
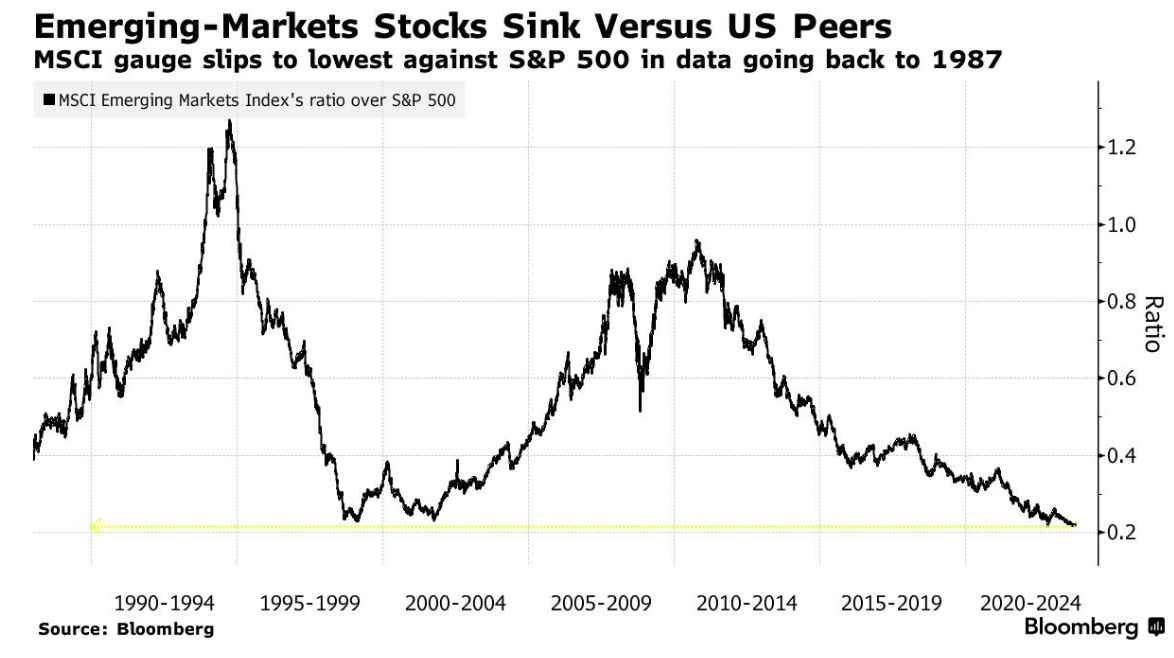
The chart above shows the relative performance of the ETF EEM versus the S&P 500 since 1987. You can first see that the ratio is at an all-time low, meaning emerging markets could be at the bottom. The other pattern that is very evident is that the chart above trades in cycles, for a decade emerging markets outperform (1987-1994), followed by a decade where the S&P 500 outperforms (1994-2001), followed by a decade where emerging markets outperform (2001-2010), and finally the most recent cycle where the S&P 500 has outperformed emerging markets for over a decade and in a consistent manner.
We simply think this chart is ripe for a turnaround and the cycle will change. This does not mean that the S&P 500 will tank, it can still be up but moving upwards on this chart. Emerging markets simply must outperform on a relative basis for this chart to reverse, we think several factors will lead to this.
So how are we going to play this?
Like we said we have specific exposure to regions we like and have studied up on. To gain overall exposure, we have chosen a broad ETF that covers emerging markets all across the world.
We think the iShares MSCI Emerging Markets ETF is a well-diversified investment vehicle
that will suit our needs for this investment theme. The ETF gives our investors exposure
to large and mid-cap companies and seeks long-term growth. Since inception, the
average return is above 8%. The $18 billion fund has no liquidity issues and a long track
record of performance. The average P/E ratio is 18x in the fund which is well below the P/E for most developed nations. On a price-to-book ratio, this fund trades extremely inexpensively, at 1.8 times book.
The fund has exposure to several nations across the world including China, India, Taiwan, Brazil, Saudia Arabia, Mexico, Indonesia, Thailand, and many more. We think many of these economies are going to grow quite rapidly. We also think the overall valuations are very attractive for us at these levels.
We have been critical of China in the past and have not changed our minds on the country and the CCP. We think they still have increased geopolitical risk that we have talked about in the past. Companies will continue to exit China due to trade restrictions. However, Chinese equities trade extremely inexpensively after a 2–3-year bear market, the CCP is committed to stimulating the economy and equity markets, and China is one of the most innovative companies in the world. The country will create domestic competitors due to the firms leaving their borders and these companies will more than likely serve as an alternative to Western firms in countries across the world. The other reason we can stomach this China exposure is that Chinese equities only make up 27% of the ETF we mentioned. Our initial position in this ETF will also be relatively small, making the ‘China exposure’ in our investor’s portfolios less than 1% of their capital. We think the risk-reward for this investment is quite attractive at this juncture. We will also mention that this is not a trade but an investment.
Disclaimer: MacNicol & Associates Asset Management holds shares of EEM in various client accounts.
Inflation: not only at the gas pump, and grocery store
Inflation is a real thing. As we all know prices have risen rapidly in the last 3 years. We will not dive deeper into it as we regularly talk about inflation, the causes of inflation, and much more regarding the economy.
Today, we wanted to talk about another form of inflation, grade inflation. That’s right in recent years as prices have risen so have the grades of high school graduates.
We ran by a chart from one of our favourites Charlie Bilelo that we decided to share with you. The chart illustrates the average GPA for high school graduates in the U.S. from 1990 to 2019. What the chart shows is a consistent bump of grades over 30 years.
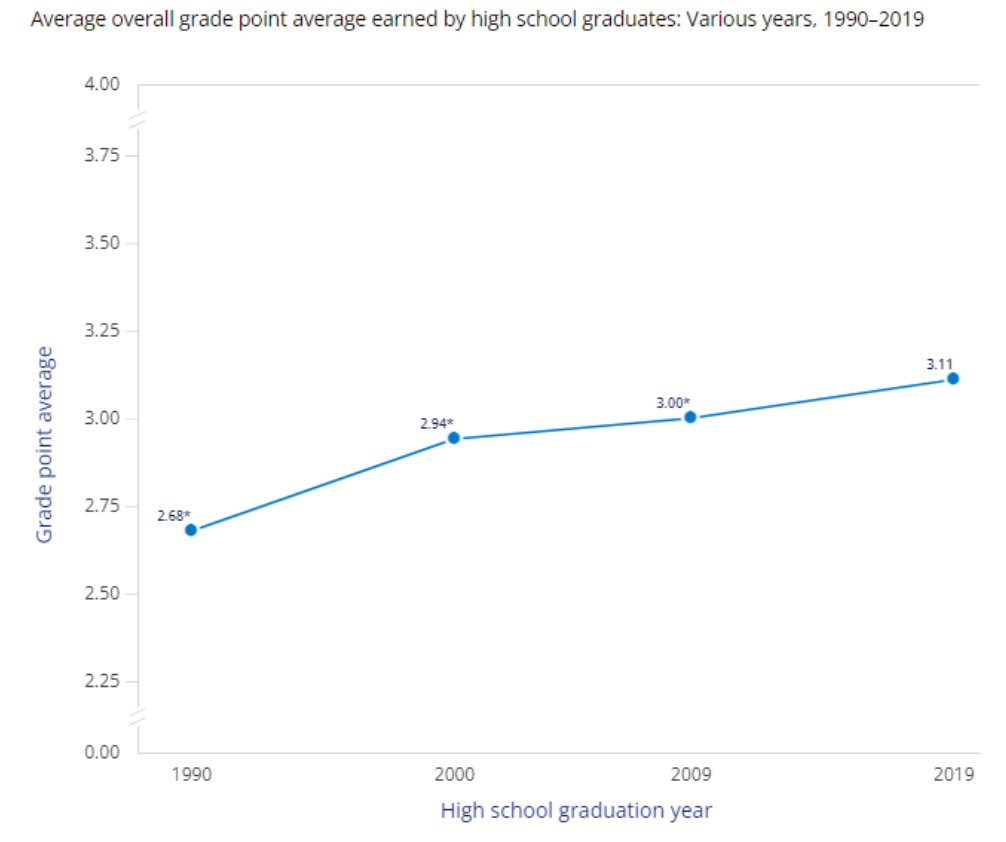
This happened for a few reasons, pressure from parents on their children, pressure from administration to make their school look better, and increased competitiveness of college admissions. The norm today is to get a university degree, 30 years ago that was not the case.
We think the chart above only got worse over the last 3-4 years since online school, COVID-19 schooling, and numerous new education policies were introduced. At one point, policymakers will have to overcorrect for their leniency in the classroom.
Another blowout in bonds
Remember all the headlines to buy bonds in 2023 after their massive blowout in 2022. Bonds had their worst year in decades in 2022. The 60-40 portfolio blew up and investors had large losses in their equity portfolios and bond portfolios. That is because the FED hiked rates at its fastest pace ever.
Last year, many championed the return of bonds and that 2022 was an outlier due to sky-high inflation. They said 2024 would have numerous rate cuts and that interest rates were headed lower. Fast forward to mid 2024 and U.S. 30-year Treasuries are having their 3rd worst year in over a century.
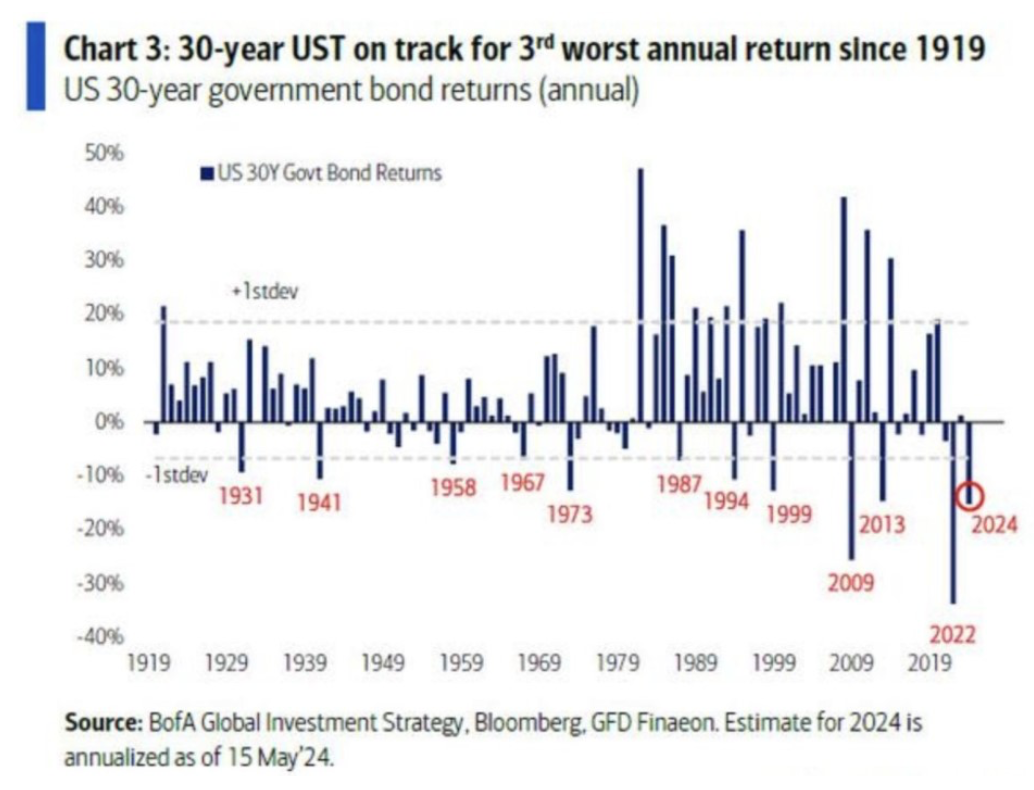
According to Bank of America Global Research only 2009 and 2024 were worse for bond funds. We hope that you did not scale into bond funds. We understand the need for diversification, but we believe commodities and alternatives serve as good asset classes to diversify into versus bonds. We think the absolute return goal of alternatives and inflation protection of commodities serve as better hedges against equity markets versus bonds.
Global Central Banks have been dumping U.S. Treasuries in favor of assets like gold. If this is not a sign to protect against ongoing inflation, we are not sure what is.
MacNicol & Associates Asset Management May 24, 2024