

Last Monthly Market Update for 2023! Time indeed flew fast.
As we head on to the New Year, we’re eager to provide insights into the current state of the market. Before we delve into the details, we’d like to remind our readers that the information shared here is not direct investment advice.
Read the full disclosure here.
Alternative Asset Trust Fund Update
Industrial Real Estate: Background
Our investment into the industrial real estate sector began back in 2016-2017 with a small piece of the pie, and then we expanded further after changes in the retail and office spaces. If you’re a commercial real estate (CRE) investor, the term “industrial” captures a lot of different assets in there but really, the ones we’re looking at are logistics, warehouses, and storage spaces.
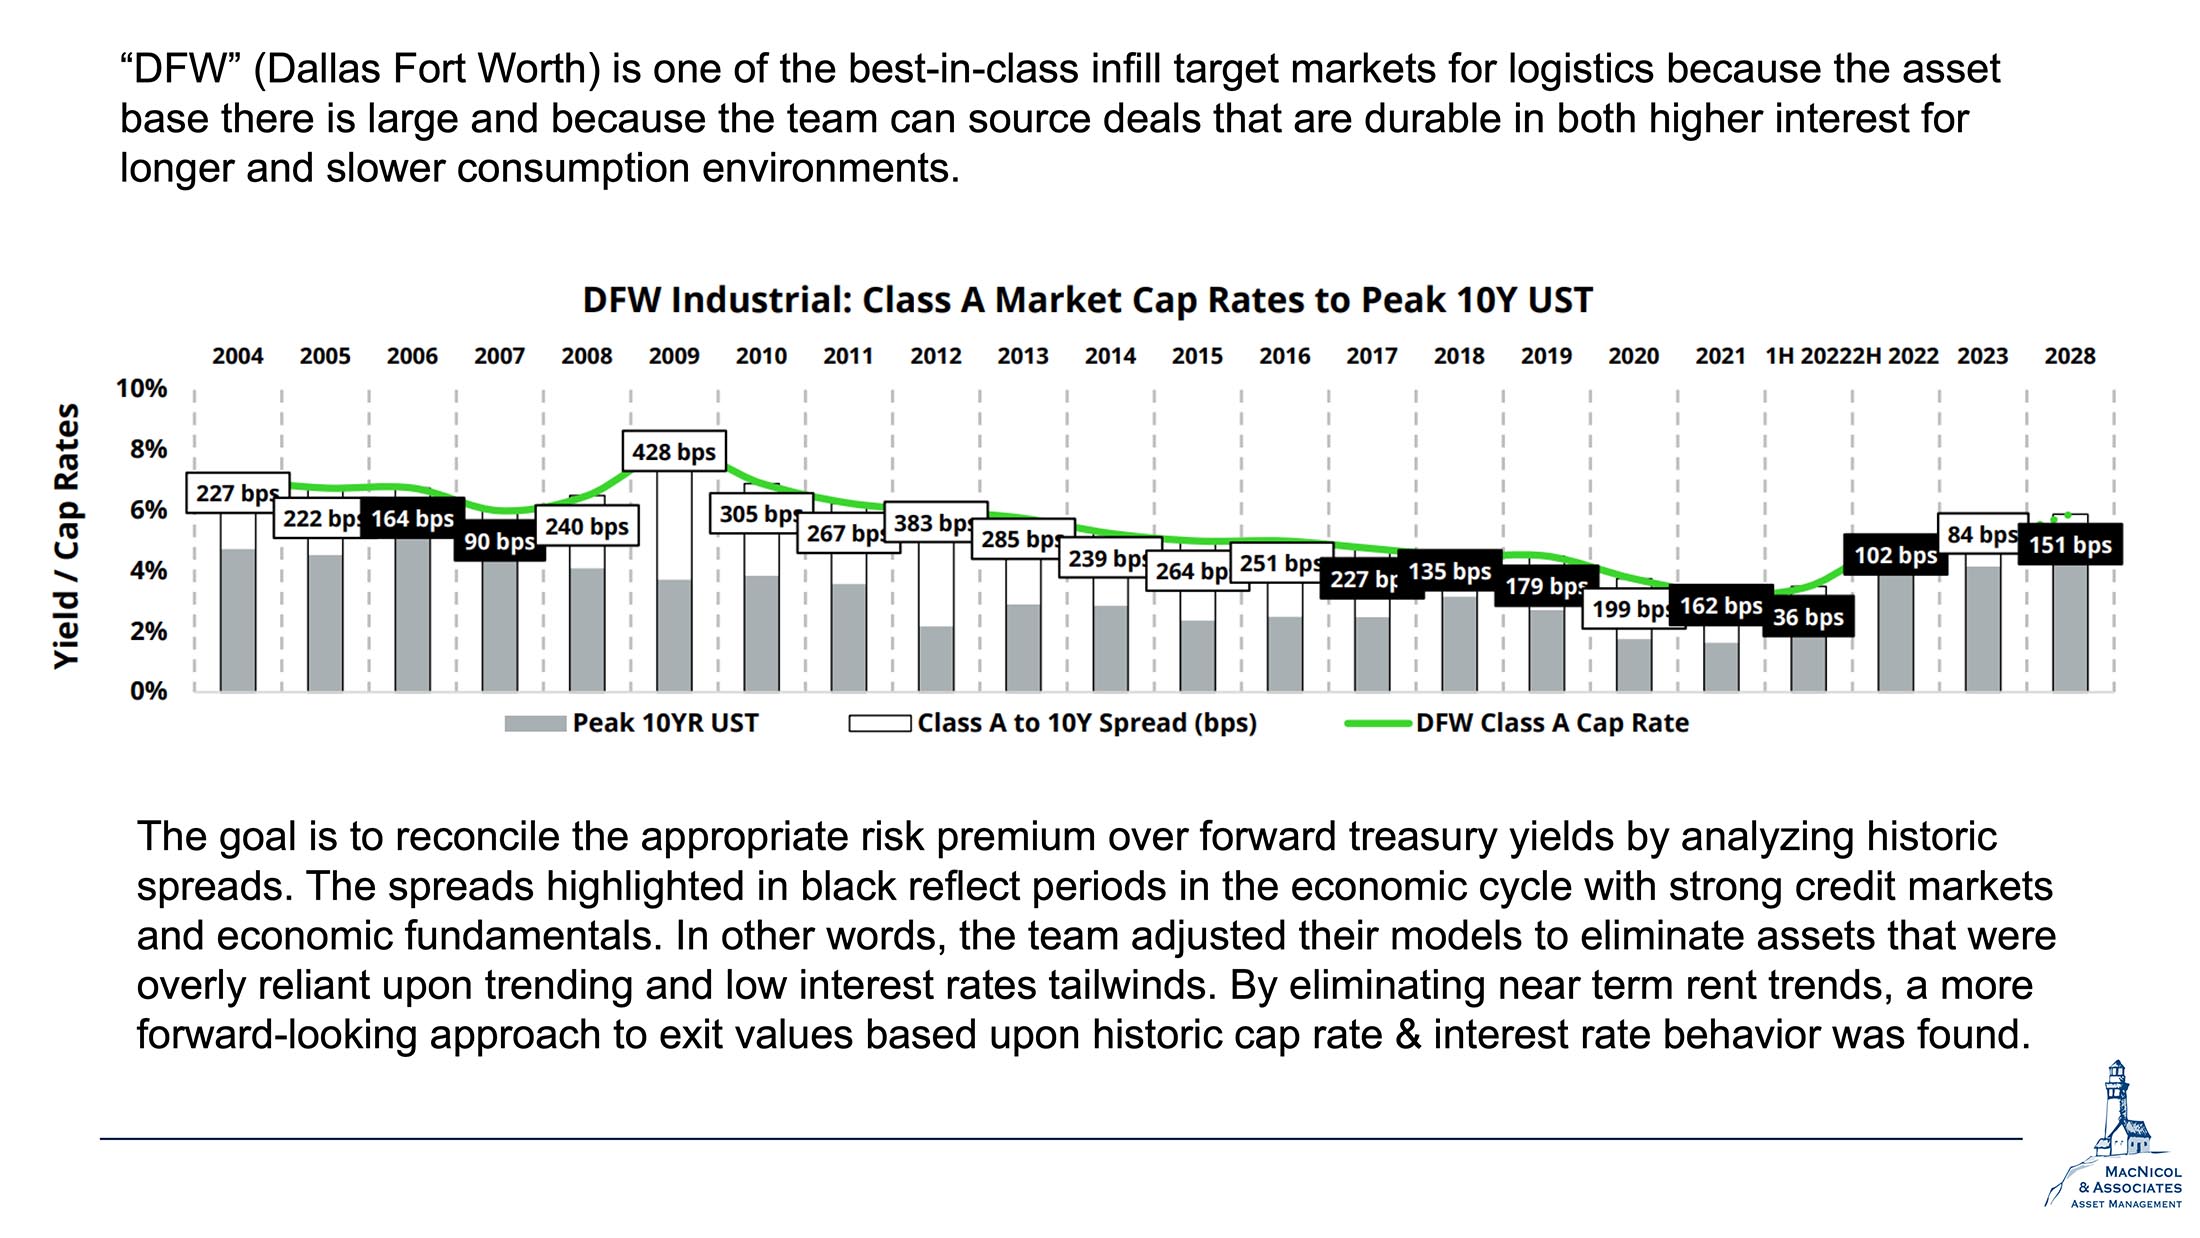
Our partnerships, particularly with Bridge, have helped us better understand how this market works. Bridge provided us with a look ahead into Dallas Fort Worth (DFW), which is one of the best-in-class infill markets for logistics. DFW serves as the central hub for the state of Texas. The significance lies in its role as a focal point for numerous onshoring activities. Onshoring, for those not deeply familiar with CRE, essentially involves the return of various goods and operations from offshore locations back to North America.
Bridge has sourced deals that can withstand both high-rate environments and lower consumption scenarios. Looking into the graph below, they reconciled the appropriate risk premium to consider relative to the forward treasury curve and analyzed that from a historical perspective.
What we want to keep an eye out for are the black boxes since they reflect periods when credit markets were strong.
Recognizing that, especially in robust markets like DFW and in resilient product categories like industrial real estate, various entities including credit funds and insurance companies actively participate in providing financing for these transactions. This is a crucial point that’s often overlooked by real estate investors or those aspiring to be one. This underscores the positive dynamics of strong market conditions and the support from reputable financial groups in facilitating such transactions.
Another significant measure that Bridge has taken is the exclusion of the COVID factor from their analysis. They’ve deliberately removed some of the rapidly changing market data to provide a clearer picture of why we’re venturing into this sector. The rationale behind this strategic move is rooted in the inherent durability, reliability, and lower risk associated with industrial real estate when compared to retail and office spaces.
Caution is still needed, as with other investments, but with what we’ve seen, industrial real estate stands out for its solid attributes.
Industrial Real Estate: Base Case Scenarios
The graph below represents the two primary scenarios that not only Bridge but also many of our logistics and real estate partners are currently considering. It essentially boils down to rates, inflation, and consumption.
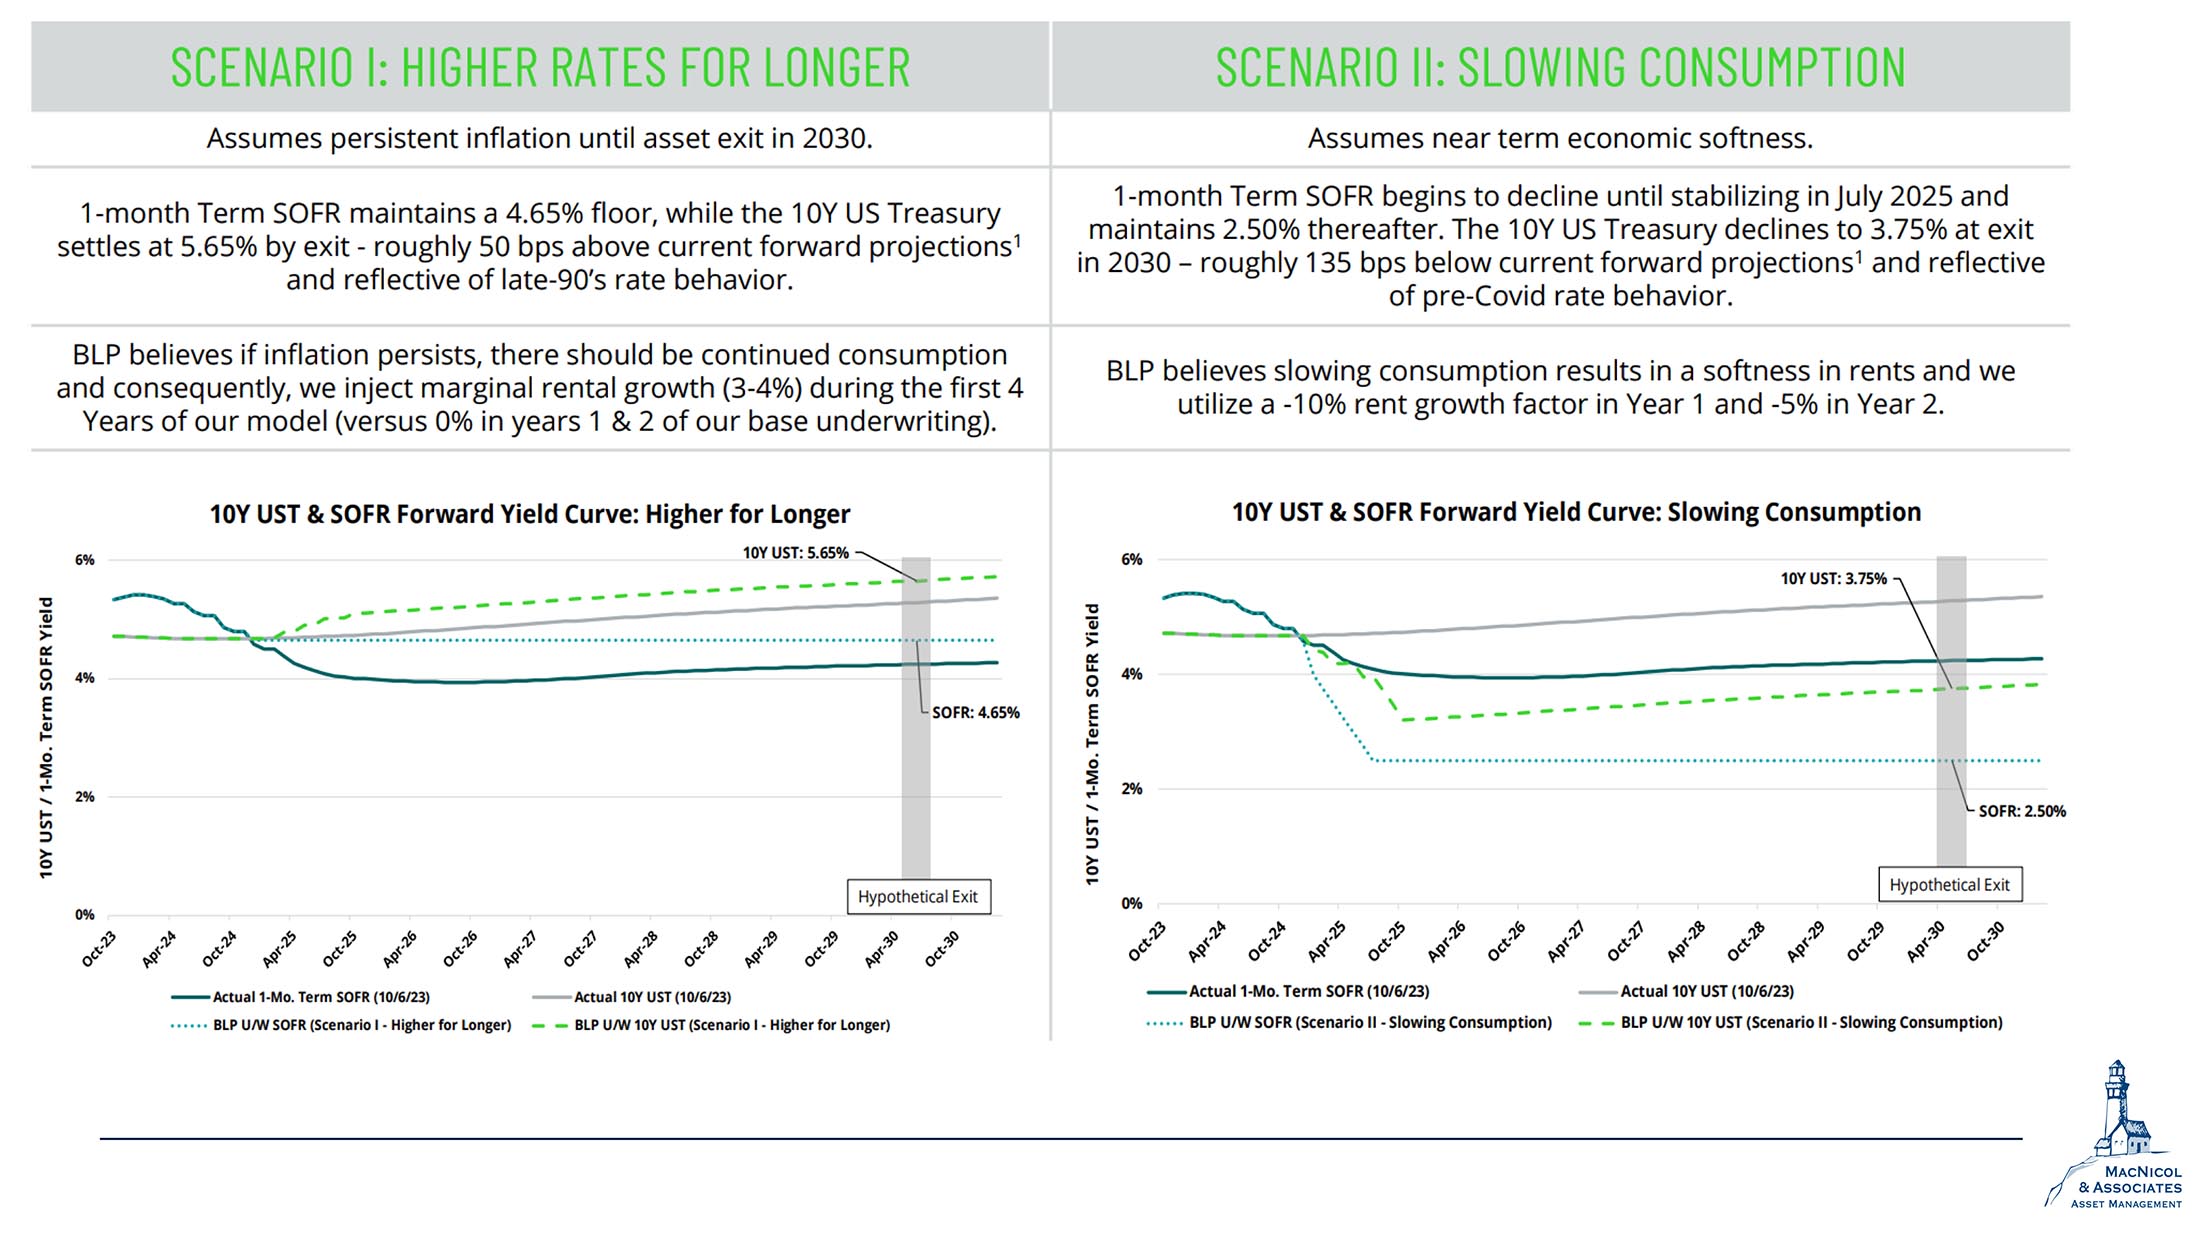
In scenario one, which involves prolonged higher rates, there’s a positive outlook for industrial real estate because it allows for the passing on of rent increases to assets, resulting in higher cash flows for investors.
Conversely, the right panel outlines the so-called slower consumption scenario which is what we’re starting to see now. In this context, a decrease in consumption could potentially lead to softened rents. This is why it’s crucial to be strategically positioned in robust, growing markets like DFW, although we are already engaged in several others with similar characteristics.
Adjustments have been made to exit caps and rate assumptions to align with the ongoing economic shift. The focus has shifted away from COVID and e-commerce dominance to a comprehensive assessment of the current economic status. This includes an outlook on interest rates and inflation over the next twelve months, shaping the way we approach this asset class.
We are confident in our current position and anticipate the first closing on many of these industrial Limited Partnerships (LPs) in the first quarter of 2024. Cap calls will follow soon thereafter.
We are excited for this because this particular asset class within commercial real estate is typically challenging for individual investors to access. It’s usually the realm of major players like pension funds, making our entry into this space a notable opportunity for our investors.
Market Updates
Moving on to our market updates, we’ll break down intricate market dynamics and share our insights on potential opportunities and challenges that lie ahead. We hope these will assist you in making informed investment decisions.
S&P 500
Examining the S&P, particularly in the context of the US market, it’s evident that there has been a surge over the past month, although it lacks substantial support.
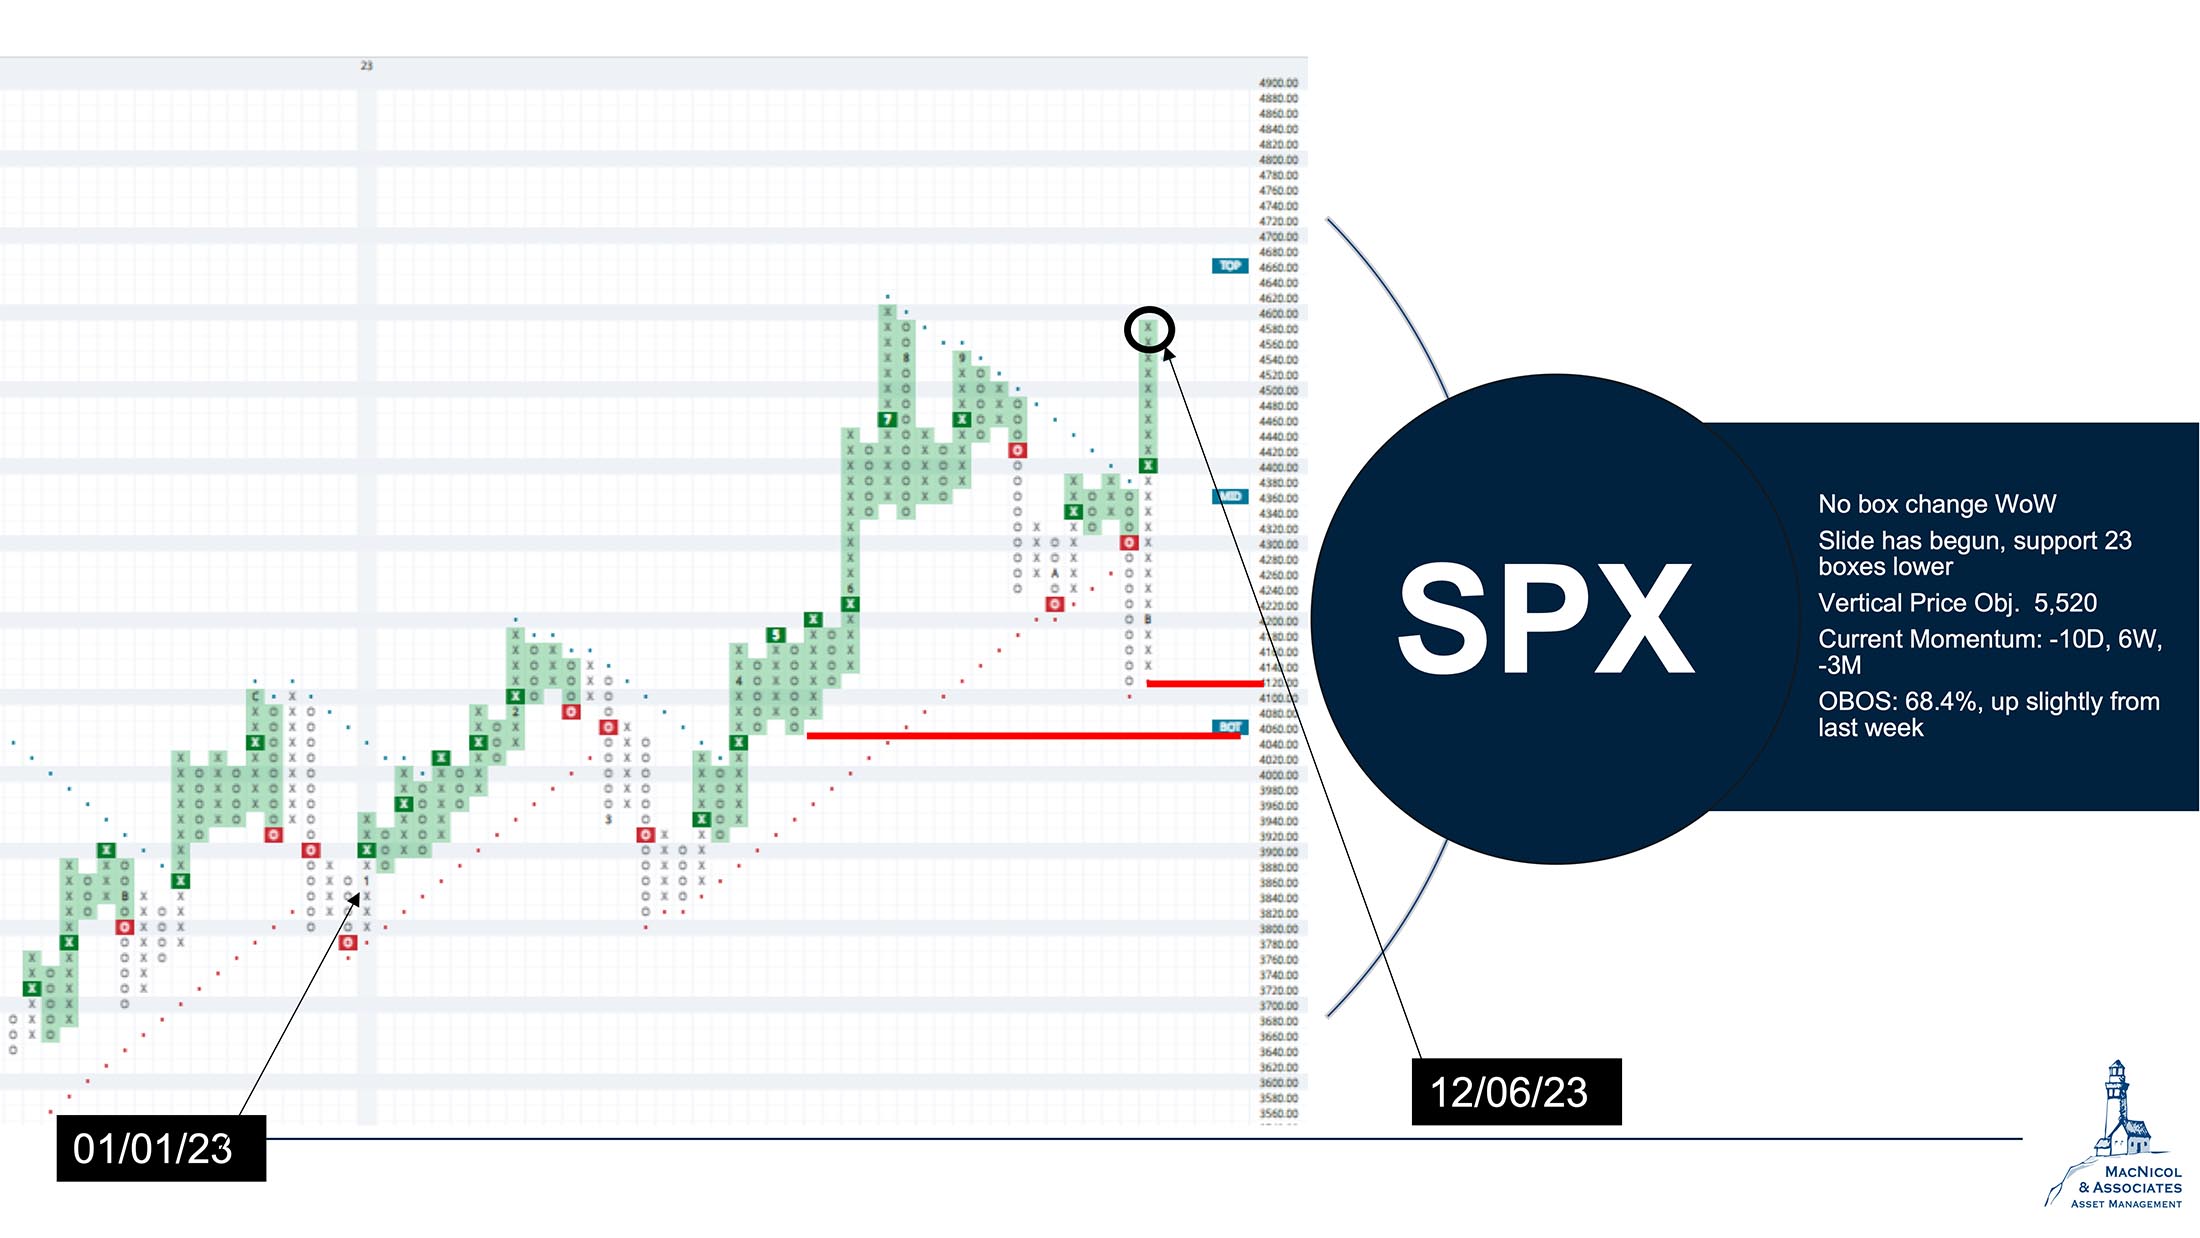
The one thing to look at when we’re analyzing the S&P is that a lot of people were forecasting a potential upward momentum, which is great, but it may have happened a bit earlier than anticipated. Seasonality trends typically show a downward trend at this point in the year, and this surge might have been factored in prematurely, potentially leading to a flatter end to the year. If we get some rate cuts early in 2024, then markets could roar.
However, our positioning is flexible, geared for both a slower, grinding market and a more explosive, upward trajectory. For now, though, we do remain bullish on our price targets for most US indices.
TSX60
The one we are more bullish on is the TSX60. It has shown a robust movement since November, generating a series of encouraging buy signals
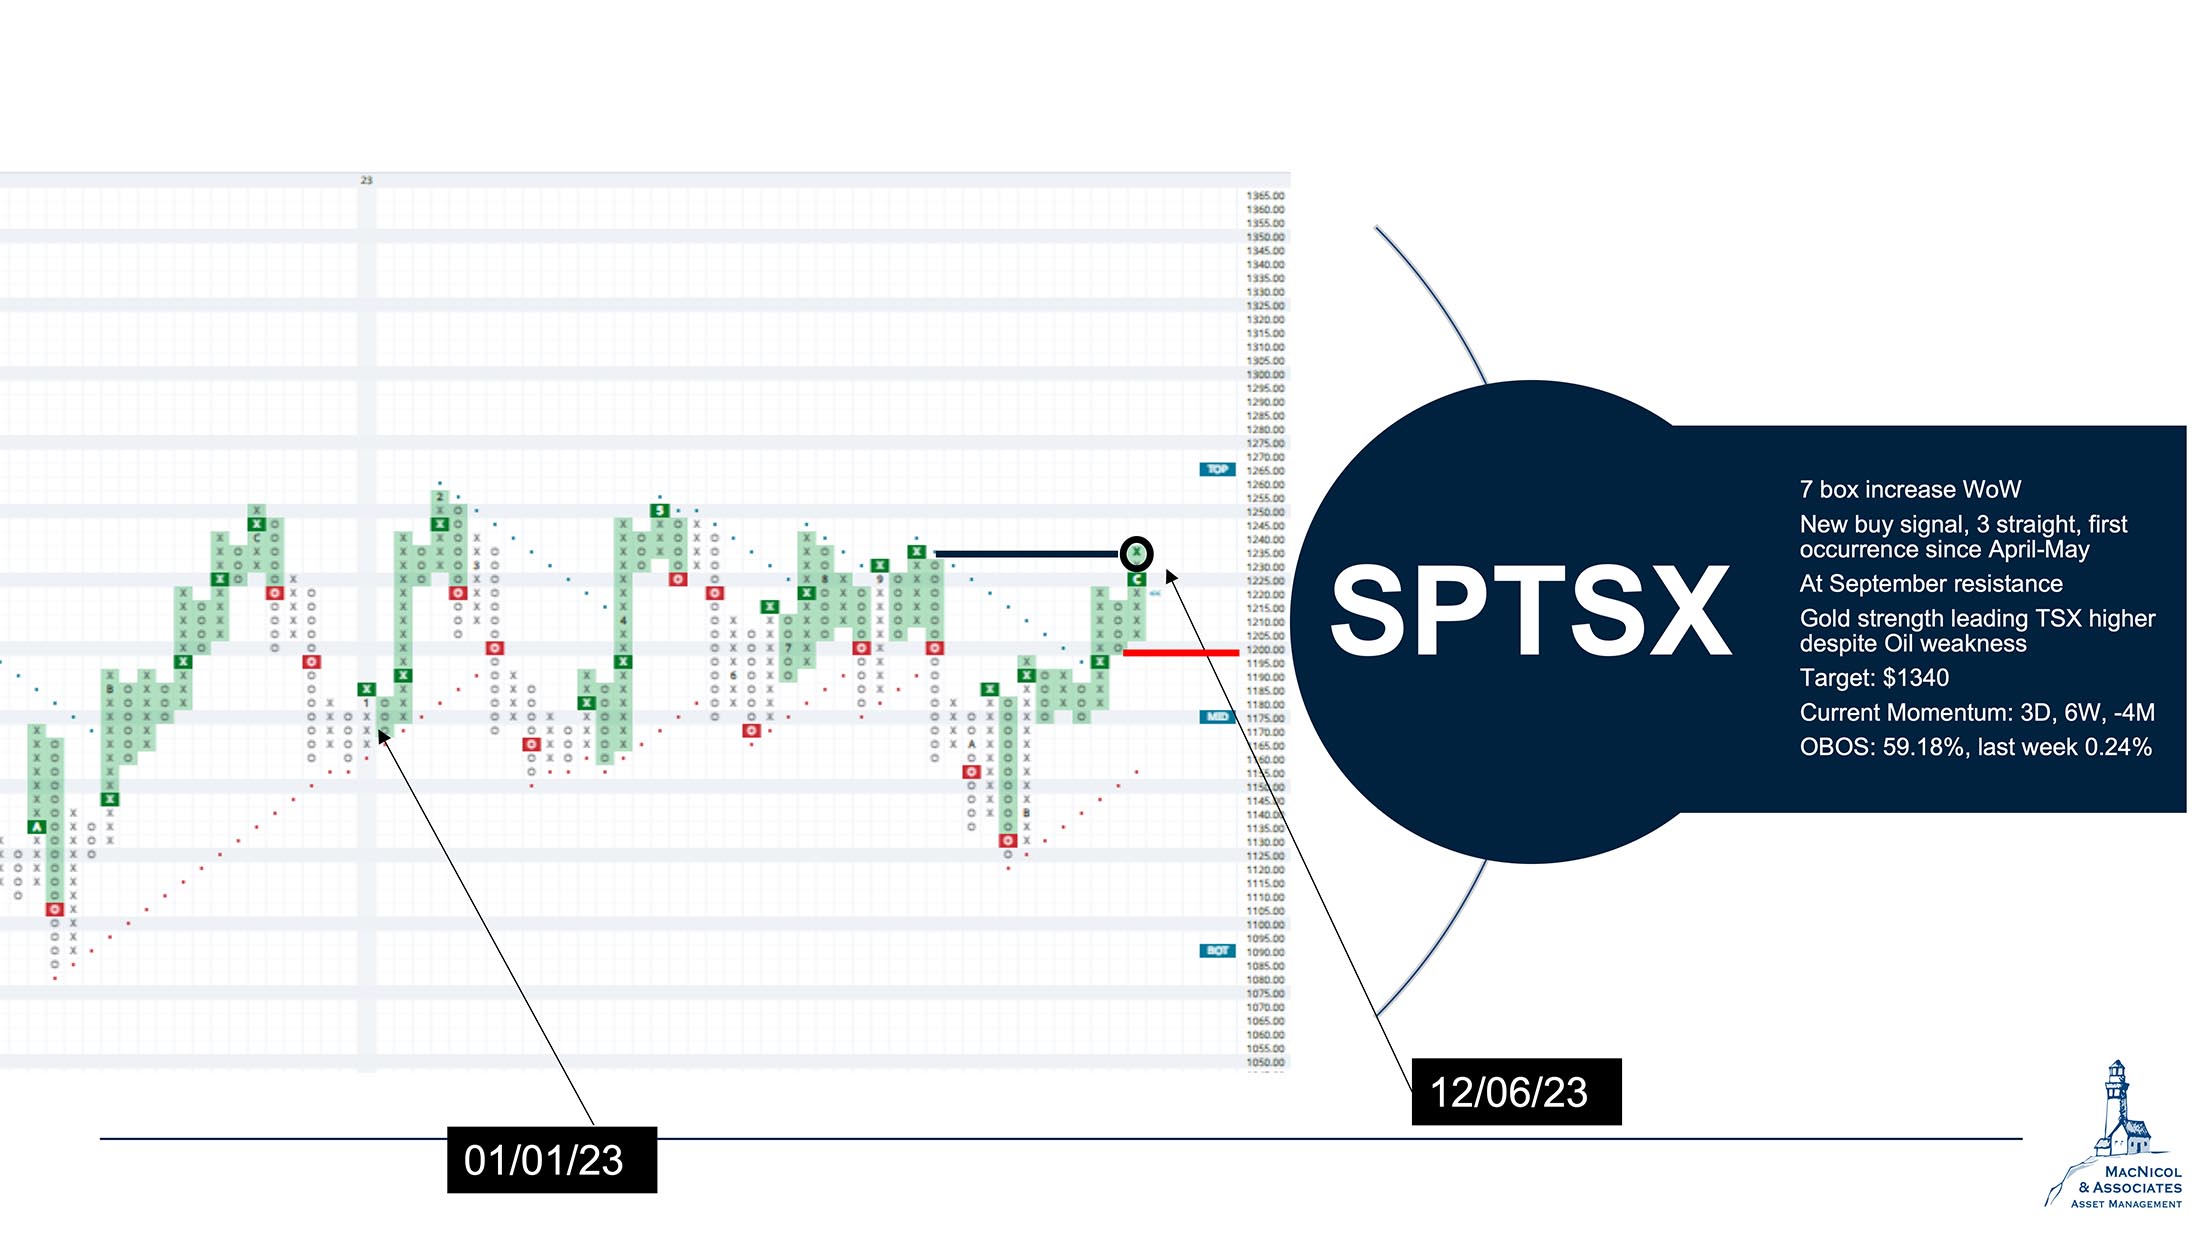
Currently resting at the September high, this might seem insignificant, but it carries the potential to gradually break free from the channel it’s traded to for over 15 months, dating back to 2022.
While this upswing has been driven by the strength in gold, there are also certain weaknesses, specifically in oil and natural gas, to which the TSX has significant exposure.
If oil does bottom here and begins an upward trend, considering the ongoing production cuts and the absence of significant demand concerns, we anticipate a potential challenge in maintaining an adequate oil supply in the future.
Considering these dynamics, we believe that the TSX might experience a significant upside. This is contingent on a shift in the trends of oil and energy equities as we transition into the next year.
Bullish Percentage Chart
The graph below shows the percentage of stocks in the TSE that are trading in a bullish pattern. Notably, there has been a positive reversal in the past month with a 6% upward movement. This marks a significant shift, as it’s the first time in nearly a year that we’ve observed an upward trajectory.
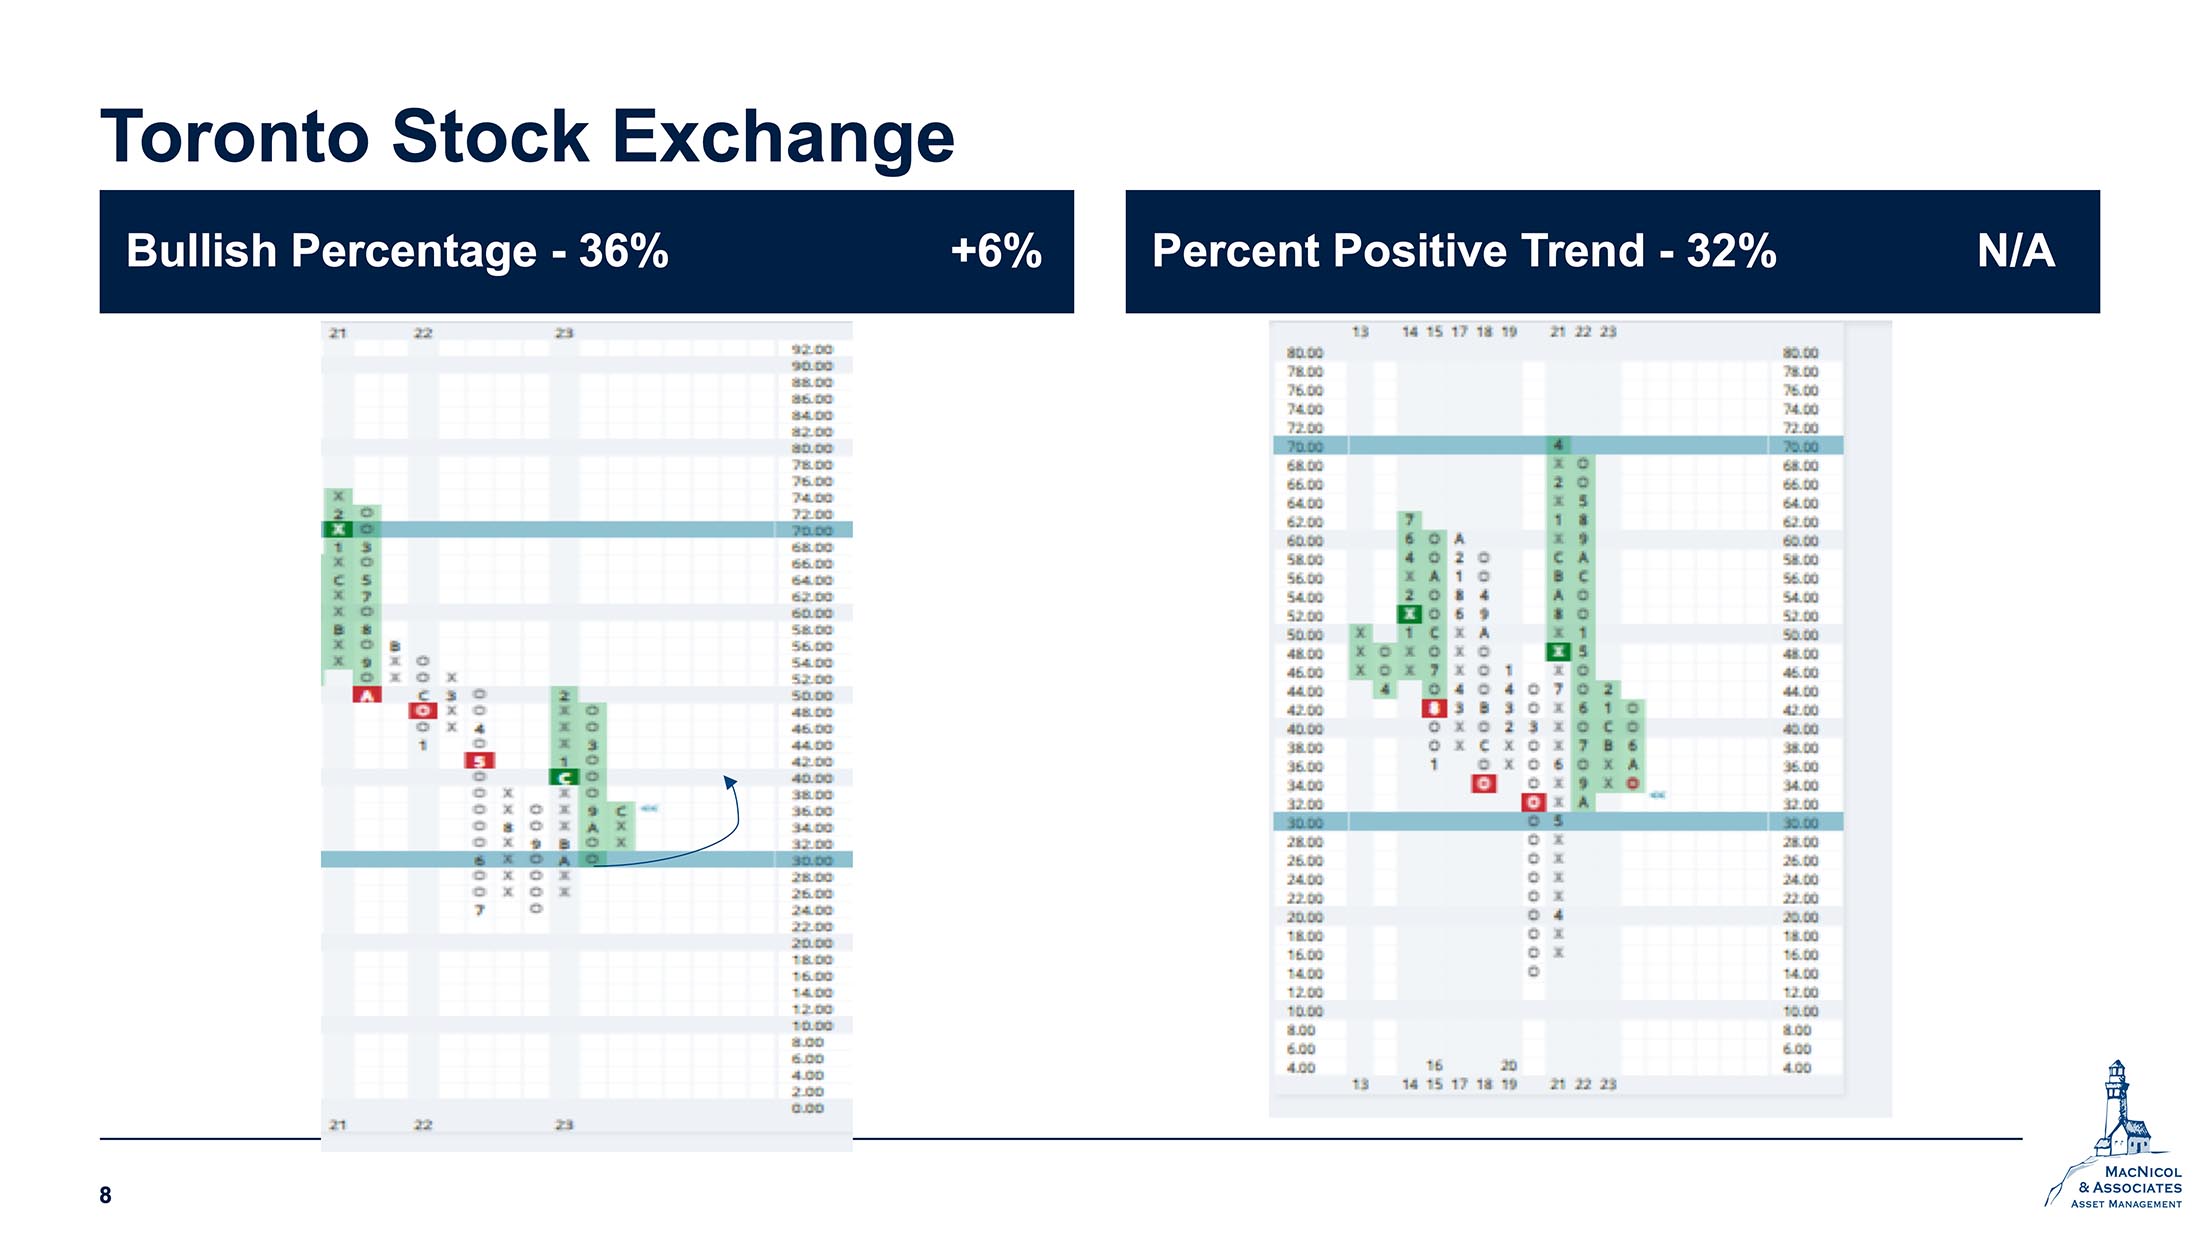
The technical indicators are aligning favourably, indicating a bullish setup for Canadian equities. This positive trend provides an encouraging signal for those considering or currently involved in the Canadian equity market.
We showed a few charts in a couple of our common areas over the past few weeks that compare global equities to US equities and how they have the largest gap on a relative basis, dating back 40-50 years. As a Canadian manager, we’re exploring the addition of global exposure. This is not only limited to the Canadian market but extends to other parts of the world. Currently, we already have substantial exposure in a few emerging markets, and we are looking into further expansion of our coverage in this regard.
S&P PE Ratio
The chart below shows the Magnificent Seven compared to the rest of the S&P. The Magnificent Seven –composed of Tesla, Nvidia, Meta, Amazon, Apple, Microsoft, and Alphabet – surged by about 70%, while the remaining 493 have seen a more modest increase of about 9%. This top-heavy market trend is somewhat unprecedented in recent history.
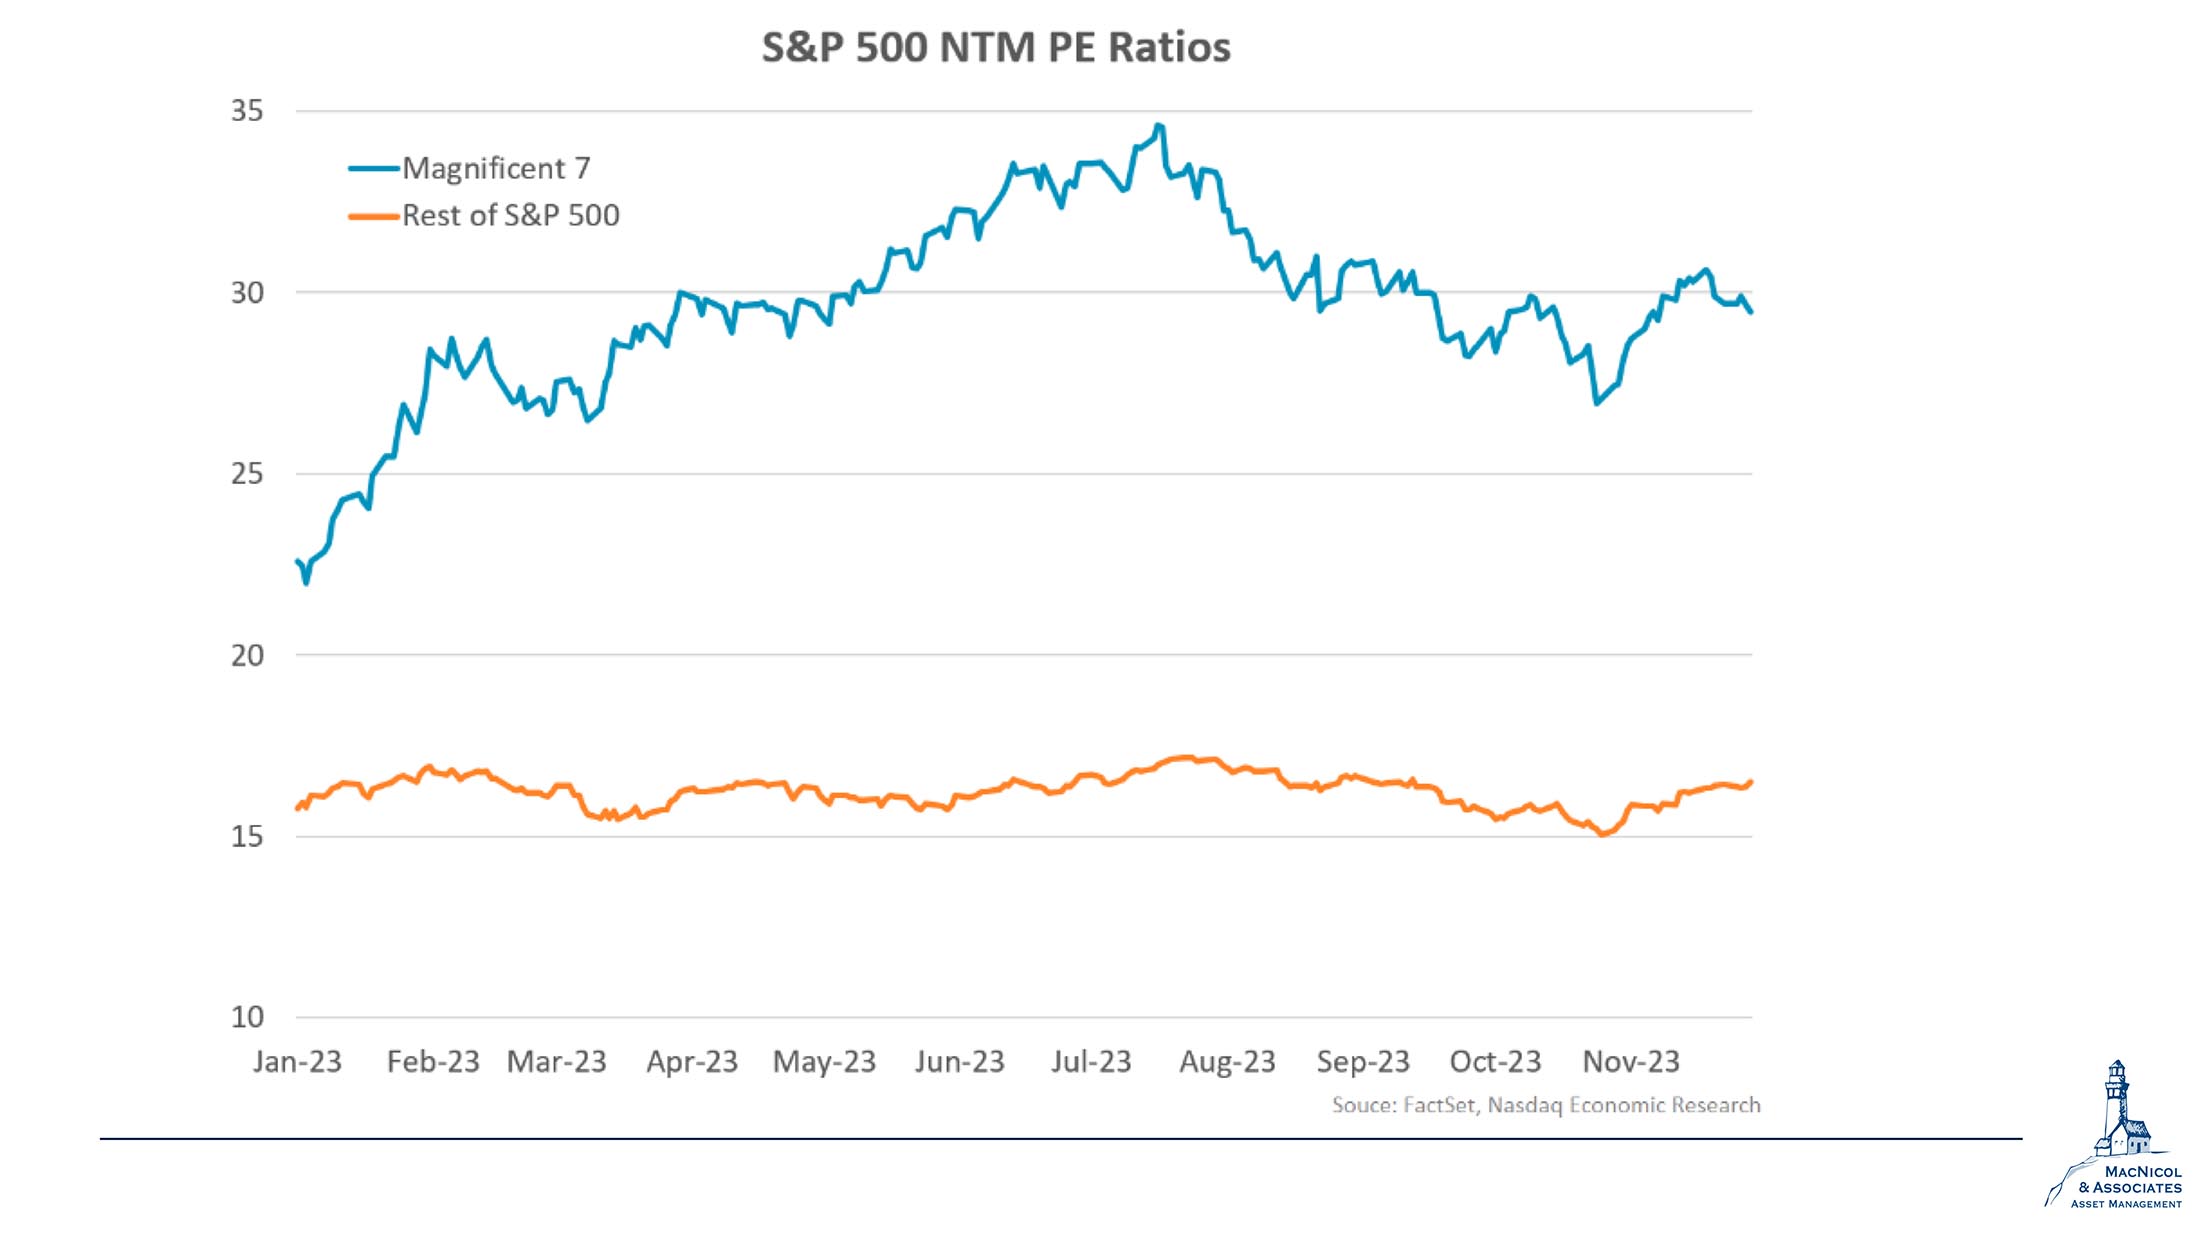
Interestingly, the significant outperformance of The Magnificent Seven is not attributed to earnings growth but rather to robust price momentum. Investors seem to be flocking to these mega-cap companies, perhaps driven by pure optimism and FOMO (the fear of missing out).
There’s a perception of safety in these larger companies, despite the fact that their earnings haven’t necessarily seen a substantial expansion. For instance, Apple has experienced stagnant numbers, and Amazon is exploring new avenues to reignite growth. Nvidia, with its focus on AI chips, presents a different narrative, but overall, the investment in these companies, now trading at a PE ratio of about 30, comes with increased risk compared to when they were trading at 22 earlier in the year.
This observation serves as a cautionary note, especially if you’re considering individual equities in your portfolio.
Gold’s Performance
Lastly, it’s not foreign to anyone that we invest in gold – physical, ETFs, and individual stocks. We are happy with the recent breakthrough in gold prices, even though there has been a slight retreat since this market fluctuation is a natural part of the landscape.
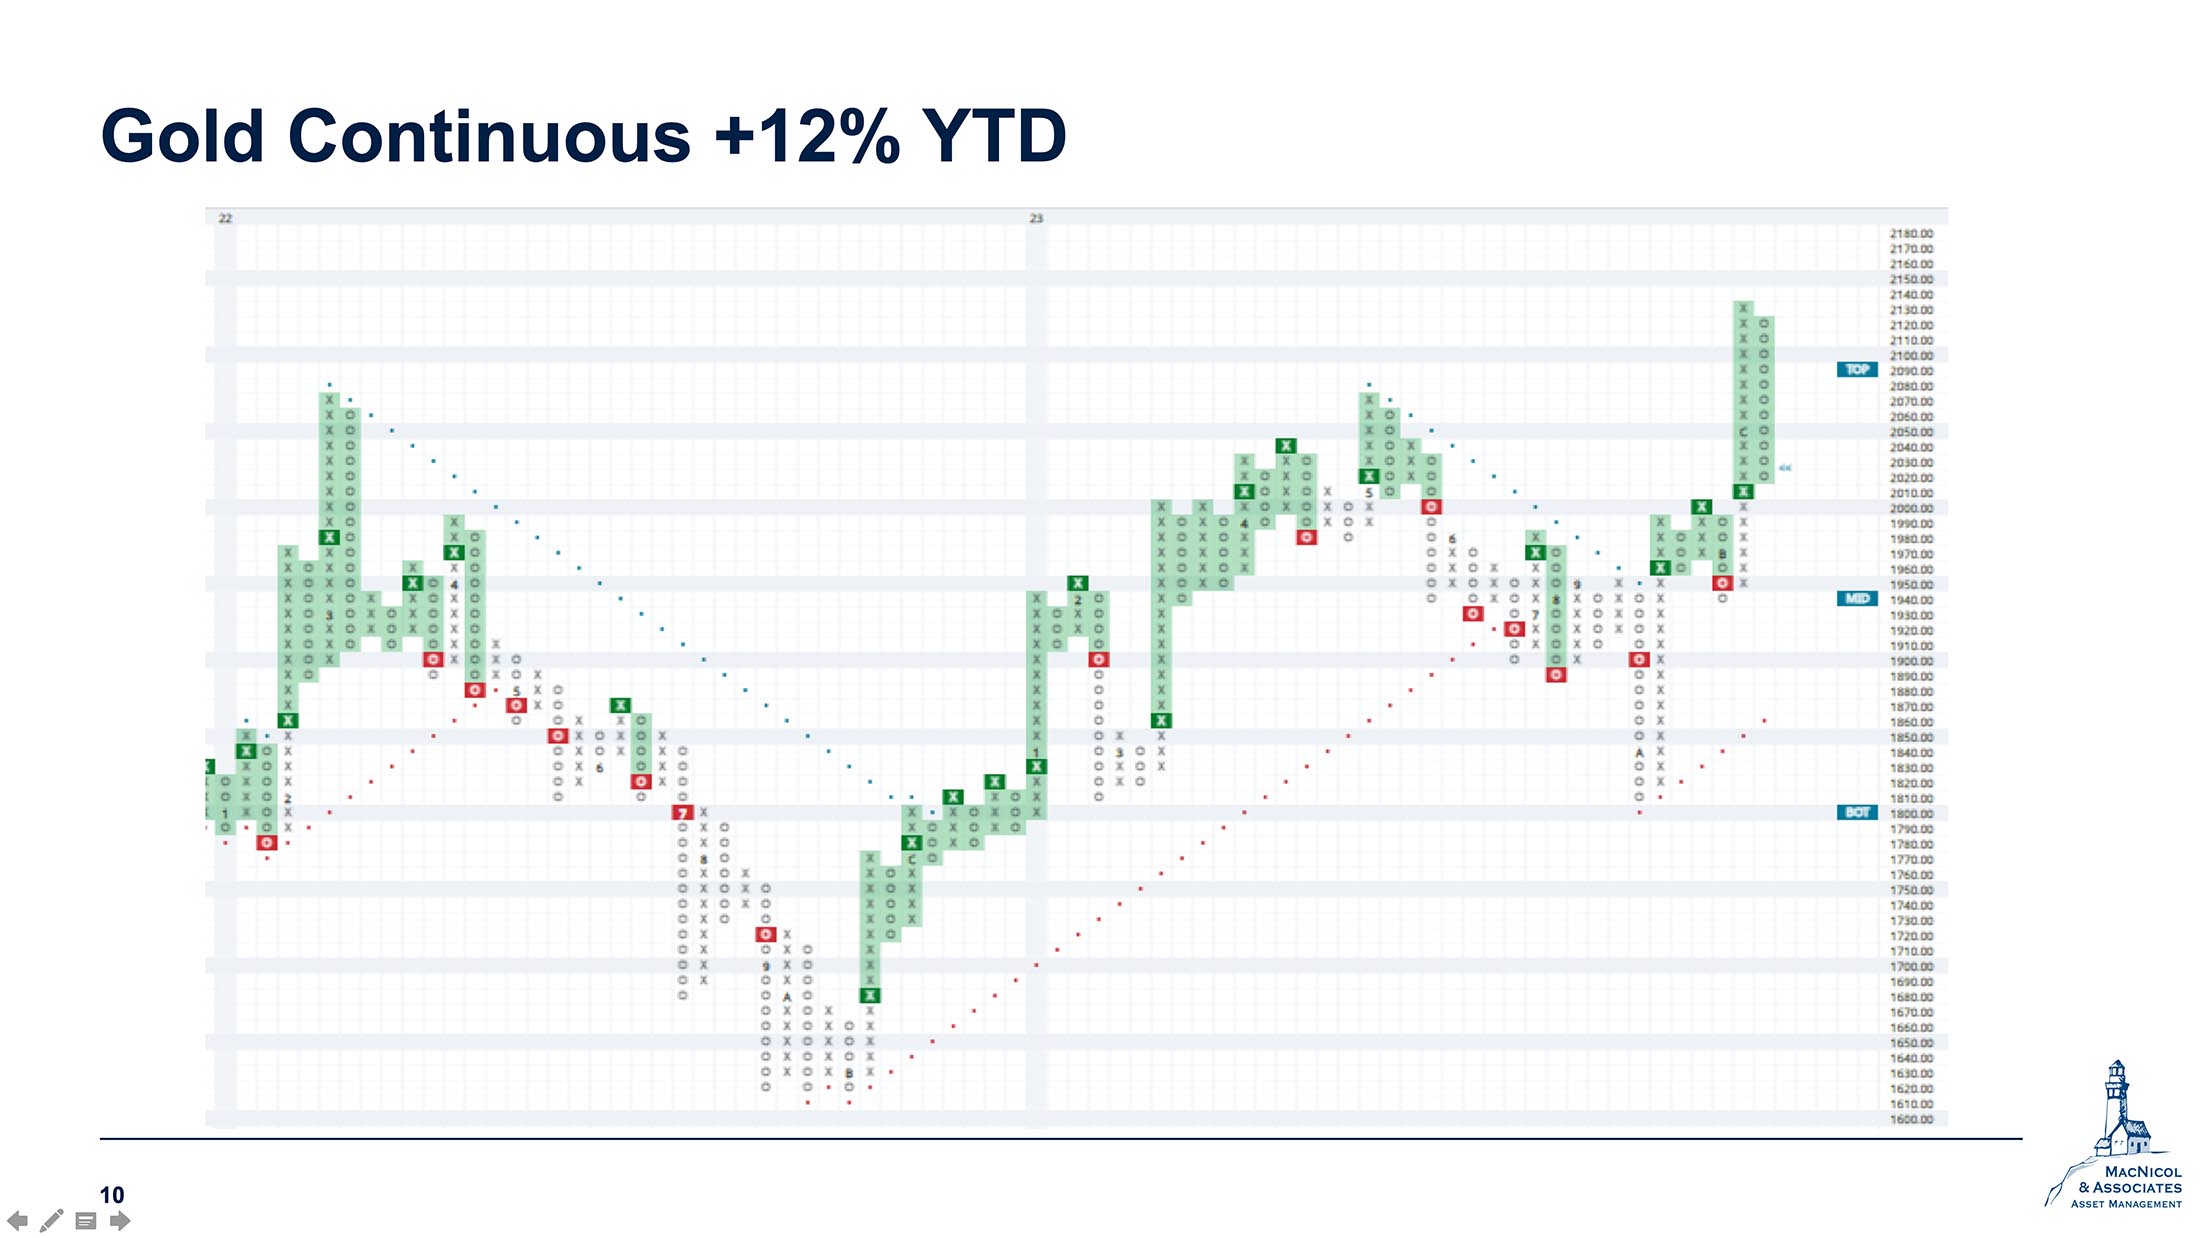
Despite the recent pullback, we maintain an optimistic outlook for gold, backed by a designated upside target. The store of value inherent in gold, coupled with its potential to catch up in the coming year following the inflationary period of the past 18-24 months, positions it as a valuable diversification in an investor’s portfolio.
Furthermore, we are keen on the potential for equities to catch up if gold prices remain elevated. Current market expectations are pricing gold at around $1700-1800, while we are observing prices comfortably above $2000. Despite a recent retreat from an all-time high, we view this as a positive development, and it aligns well with our investment strategy as we approach the year-end.
And this concludes this month’s market update. We hope that our market reviews and commentaries have given you insights into the state of the financial and economic landscape. Happy holidays and we hope you continue to join us in 2024.
If you have questions, please reach out to us and we’d be happy to help!